Exploratory Data Analysis
Telco Customer Churn

Have you ever disappointed with a telecommunications company and finally decided to move to another company? Either because the price is too expensive, the signal is not good, or because the service is not good. Now it's called Customer Churn. In this Article, Arie will provide details about EDA and try to visualize the data obtained.
Data Understanding
Target :
Numeric Feature :
Categorical Feature :
Import Package and Data
Started with imports of some basic libraries that are needed throughout the case. This includes Pandas and Numpy for data handling and processing as well as Matplotlib and Seaborn for visualization.
import pandas as pd
import numpy as np
import re

import matplotlib.pyplot as plt
import seaborn as sns
%matplotlib inline
sns.set()
For this exercise, the data set (.csv format) is downloaded to a local folder, read into the Jupyter notebook and stored in a Pandas DataFrame.
import pandas as pd
df = pd.read_csv('Telco Customer Churn.csv')
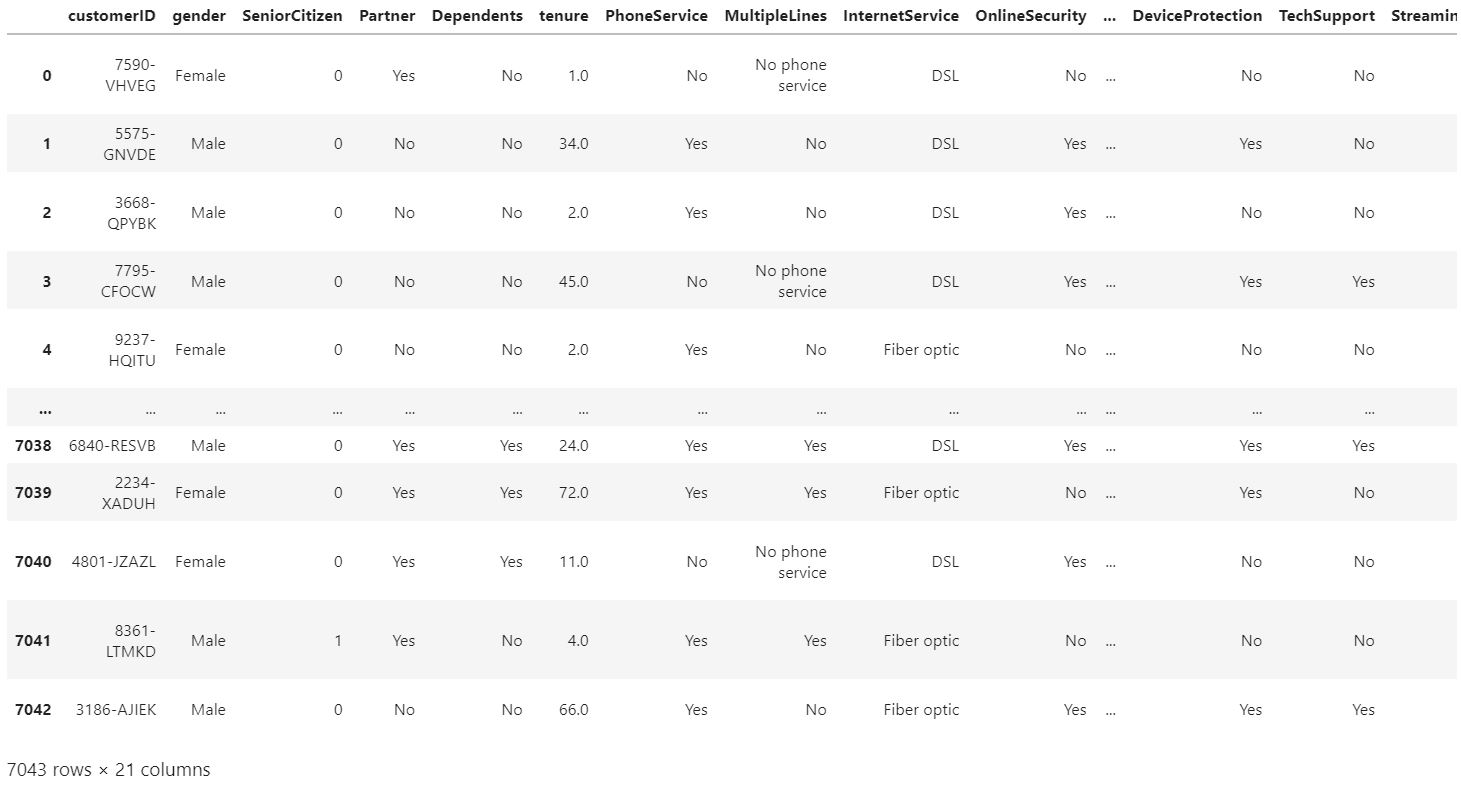
#overview dari dataset
df.head()
Initial EDA
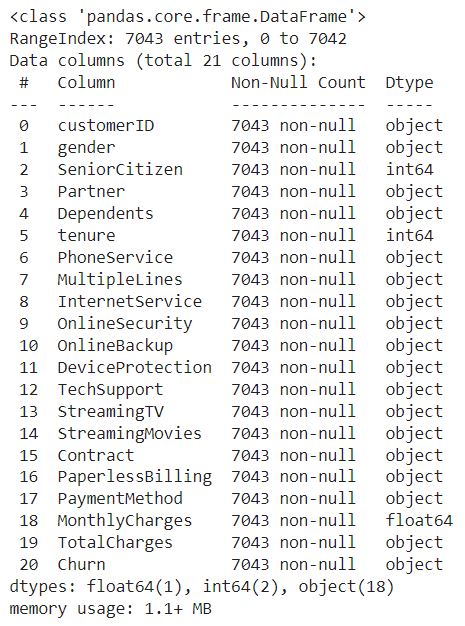
The first part of EDA the data frame is evaluated for structure, columns included and data types to get a general understanding for the data set. Get a summary on the data frame include data types, shape, and memory storage.
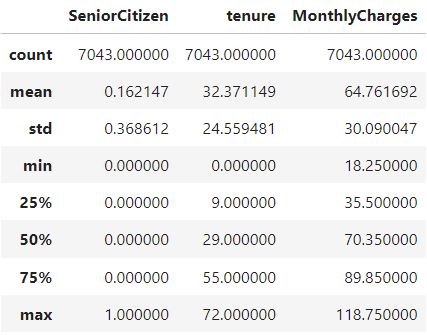
Get statistical information on numerical features.
Insight(Data Visualization + Summary)
Display Frequency Distribution For Churn
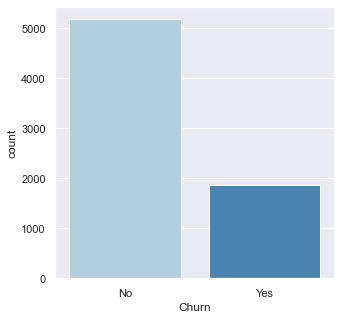
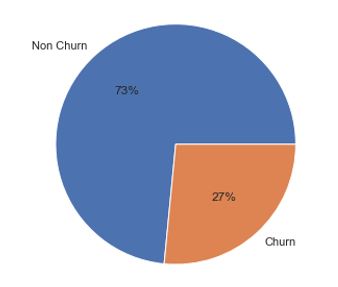
From the picture above, it can be seen that the overall distribution of data customers tend not to churn, with details of churn as much as 27% and non-churn as much as 73%. Since churn is the target variable, it will be used as an element in most EDA variables.
Exploratory Data Analysis (EDA) Numeric Variable
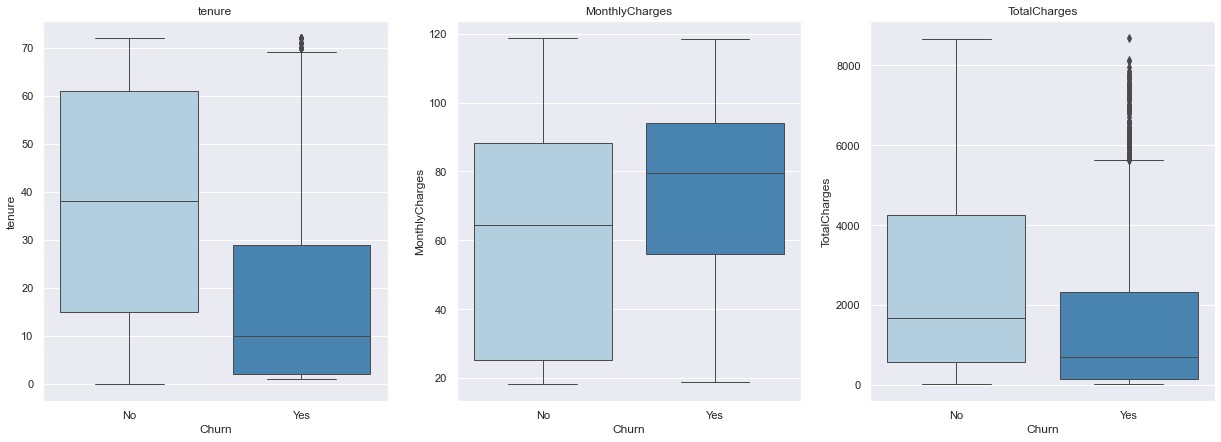
Insight:
Exploratory Data Analysis (EDA) Categorical Variable
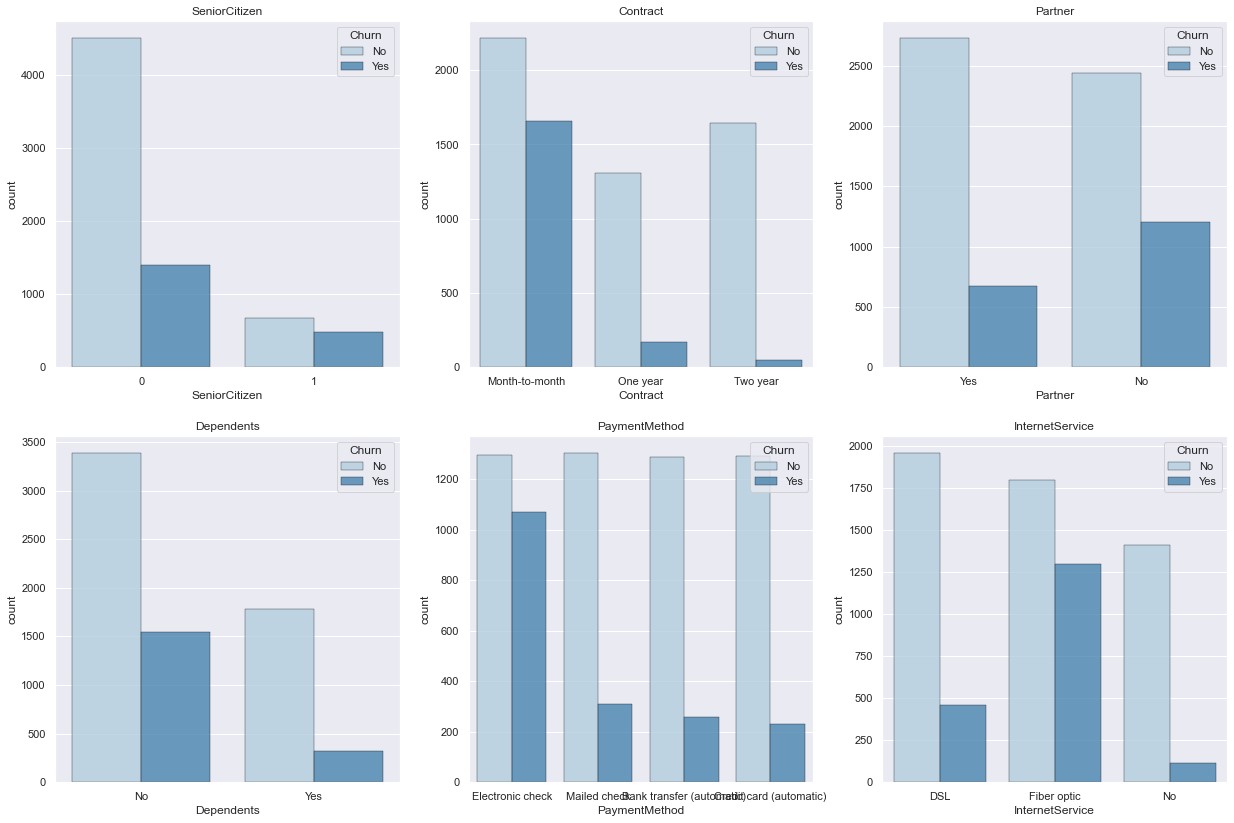
Insight:
Feature Engineering Action
Check Outlier in Numerical Feature
Check outlier by applying the IQR methid checking if values are way outside the IQR borders or visualize with boxplot to see the outliers.
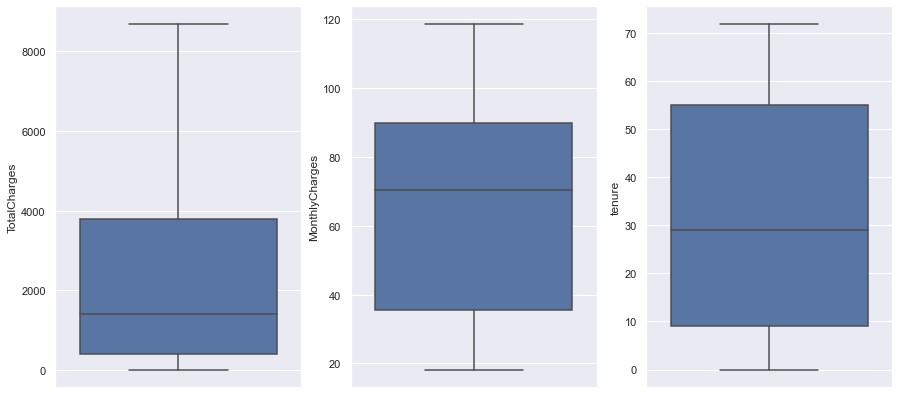
There are no Ouliers on the numerical features when checked using the boxplot and the IQR method, so there is no need to do anything.
The next step is drop the rows with missing values for data cleaning.Based on the data types and the values, following actions are defined to preprocess/engineer the features for machine readibility and further analysis:
Column Removed
No Need Action
Label encoding The following features are categorical and each take on 2 values (mostly yes/no) — therefore are transformed to binary integers
One Hot Encoding The following features are categorical, yet not ordinal (no ranking) but take on more than 2 values. For each value, a new variable is created with a binary integer indicating if the value occured in a data entry or not (1 or 0).
Min-Max Scaling Values of numerical features are rescaled between a range of 0 and 1. Min-max scaler is the standard approach for scaling. For normally distributed features standard scaler could be used, which scales values around a mean of 0 and a standard deviation of 1. For simplicity we use min-max scaler for all numerical features.
Generate new feature "Number_AdditionalSerivices" by summing up the number of add-on service consumed. Then Generate countplot for the new feature.
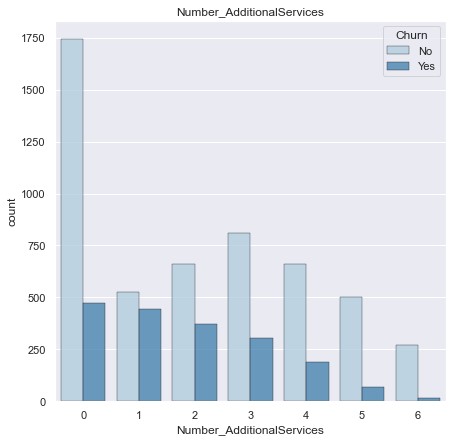
Insight:
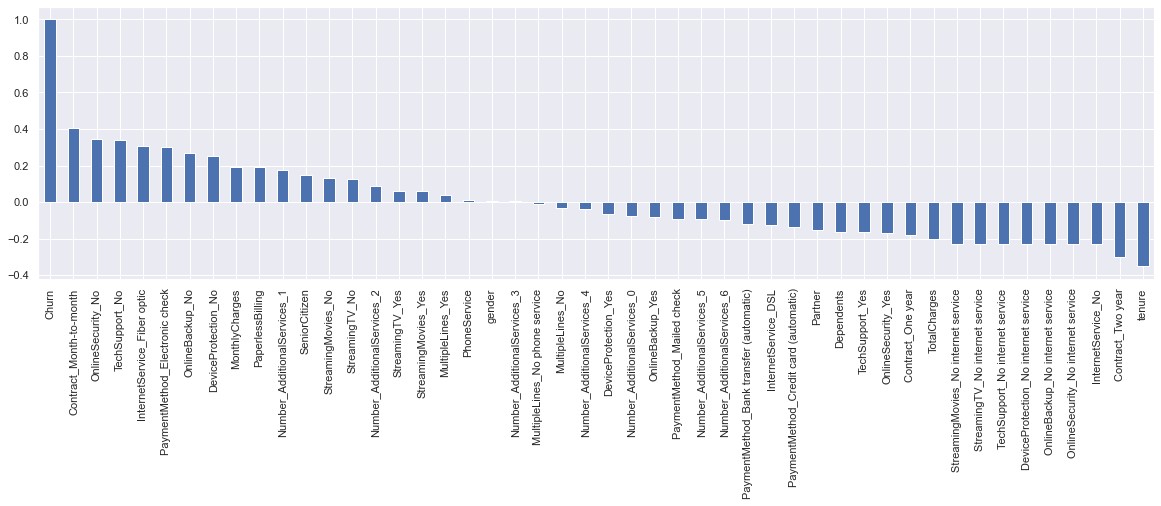
Correlation analysis