Exploratory Data Analysis
Wind Energy in Germany
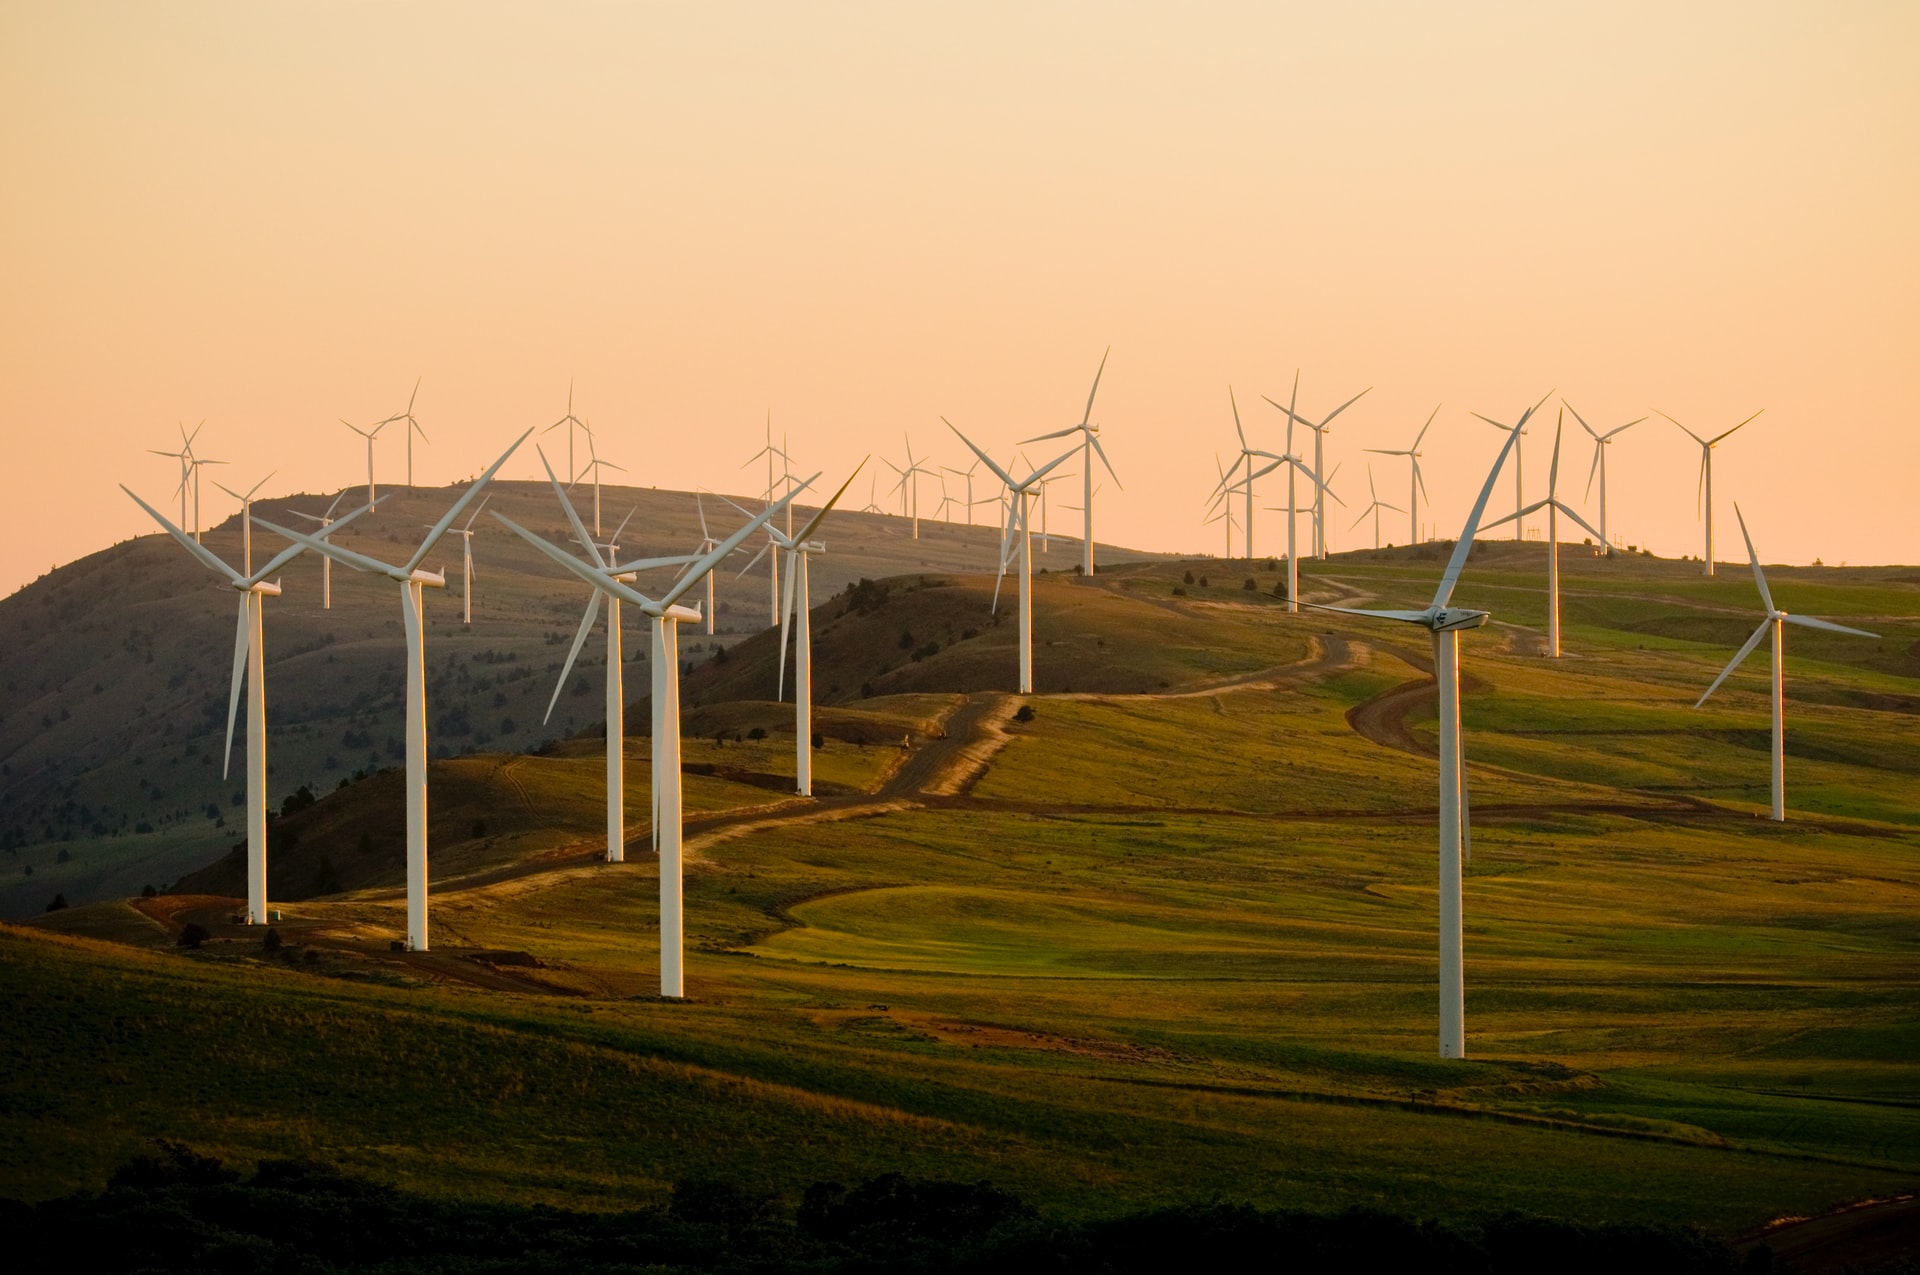
Wind power in Germany is a growing industry. The installed capacity was 55.6 gigawatts (GW) at the end of 2017, with 5.2 GW from offshore installations. In 2019, a quarter of the country's total electricity was generated using wind power, compared to an estimated 9.3% in 2010. We found the datasheet that represent the temperature and wind energy production from 2017-2019, so in this article Arie will try to provide details about EDA and try to visualize the data obtained.
Data Fields
Import Package and Data
Started with imports of some basic libraries that are needed throughout the case. This includes Pandas and Numpy for data handling and processing as well as Matplotlib and Seaborn for visualization.
import matplotlib.pyplot as plt
import numpy as np
import seaborn as sns
import os
%matplotlib inline
import plotly.graph_objects as go
import folium
import plotly.express as px
import pandas as pd
import re
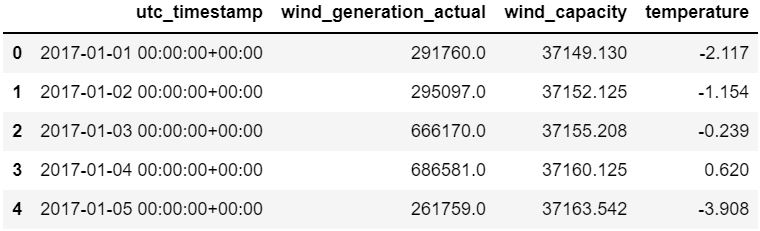
For this exercise, the data set (.csv format) is downloaded to a local folder, read into the Jupyter notebook and stored in a Pandas DataFrame.
df = pd.read_csv("C:\My Files\Document\Coding\Datasheet\germany-wind-energy.csv")
df.head()
Initial EDA
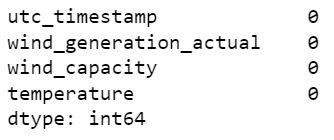
The first part of EDA the data frame is evaluated for structure, columns included and data types to get a general understanding for the data set. Get a summary on the data frame include data types, shape, and memory storage. there is 4 columns, 1094 rows and no missing value

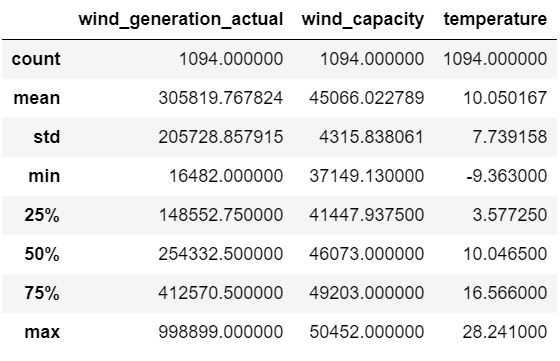
Get statistical information on numerical features.
Data Visualization
utc_timestamp with wind_generation_actual
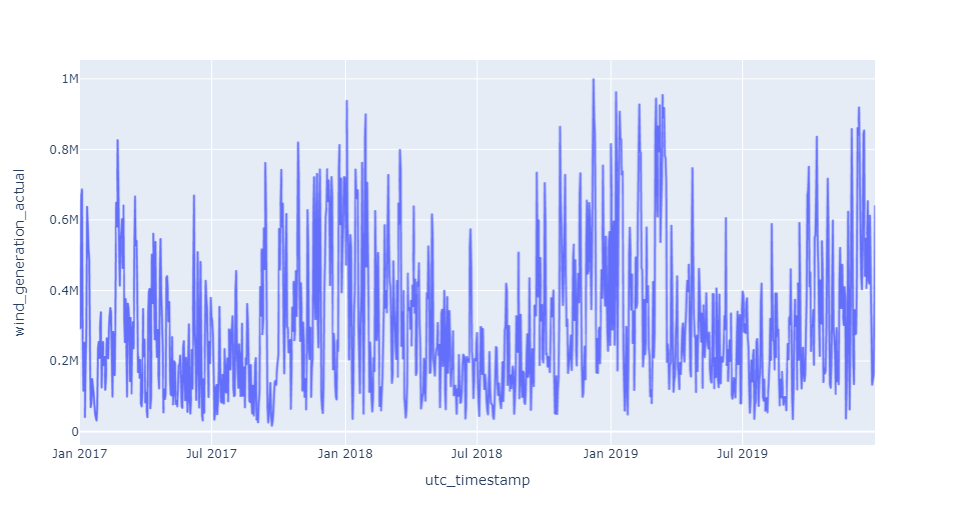
insight :
utc_timestamp with wind_capacity
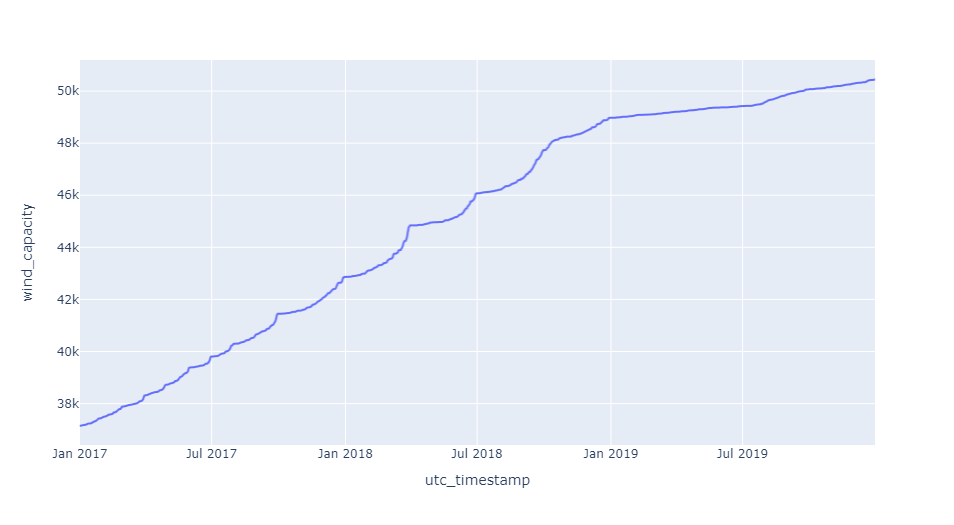
insight :
utc_timestamp with temperature
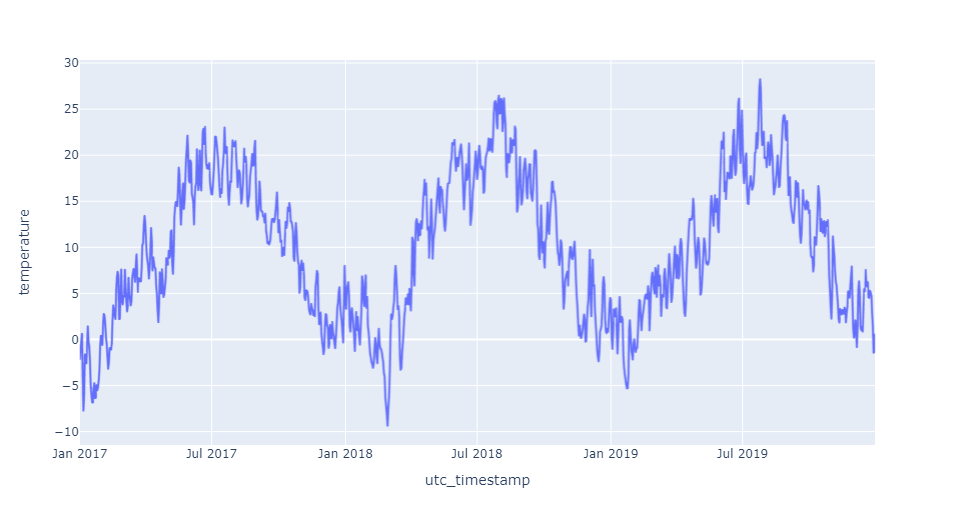
insight :
Correlation
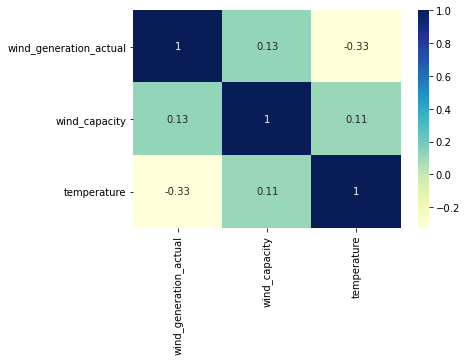
insight :