Red Wine Quality
Most wines are made with grapes, but they're not like the ones you find in the grocery store. Wine grapes (Latin name: Vitis vinifera) are smaller, sweeter, have thick skins, and contain seeds. According to wine folly, over 1,300 wine grape varieties are used in commercial production, but only about 100 of these varieties make up 75% of the world's vineyards. Wine is an alcoholic drink that is made up of fermented grapes. If you have come across wine, you will notice that wine also has its types. There are red wines, white wines. This was because of different varieties of grapes.
We can use machine learning in production process to ensure that every wine bottle has the highest quality. This will reduce the cost with regard to each wine bottle as less human labor is required for monitoring quality. Therefore, this analysis is aimed at predicting wine quality, given some important attributes in wine.
Data Fields
Import Package and Data
Started with imports of some basic libraries that are needed throughout the case. This includes Pandas and Numpy for data handling and processing as well as Matplotlib and Seaborn for visualization.
import pandas as pd
import numpy as np
import pandas as pd
import matplotlib.pyplot as plt
import seaborn as sns
import warnings
warnings.filterwarnings("ignore")
For this exercise, the data set (.csv format) is downloaded to a local folder, read into the Jupyter notebook and stored in a Pandas DataFrame.
import pandas as pd
df = pd.read_csv('C:\My Files\Document\Coding\Datasheet\winequality-red.csv')
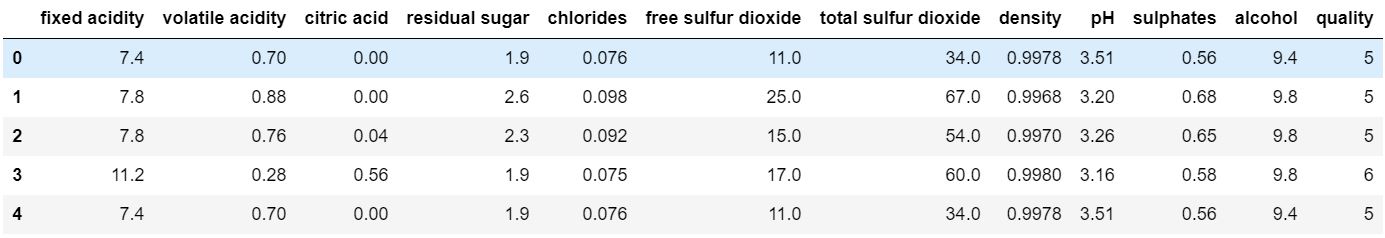
df.head()
Initial Exploratory Data Analysis
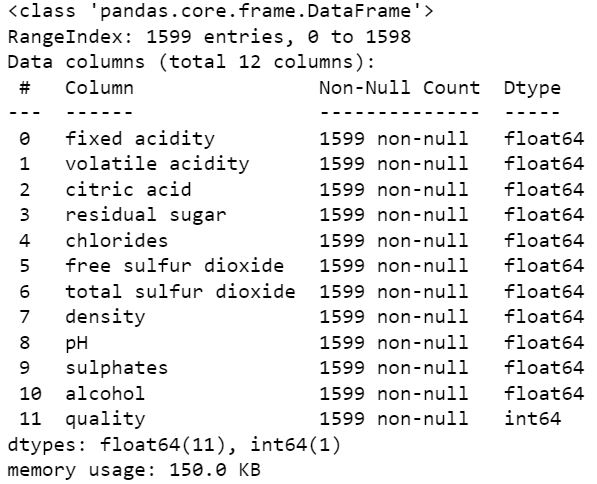
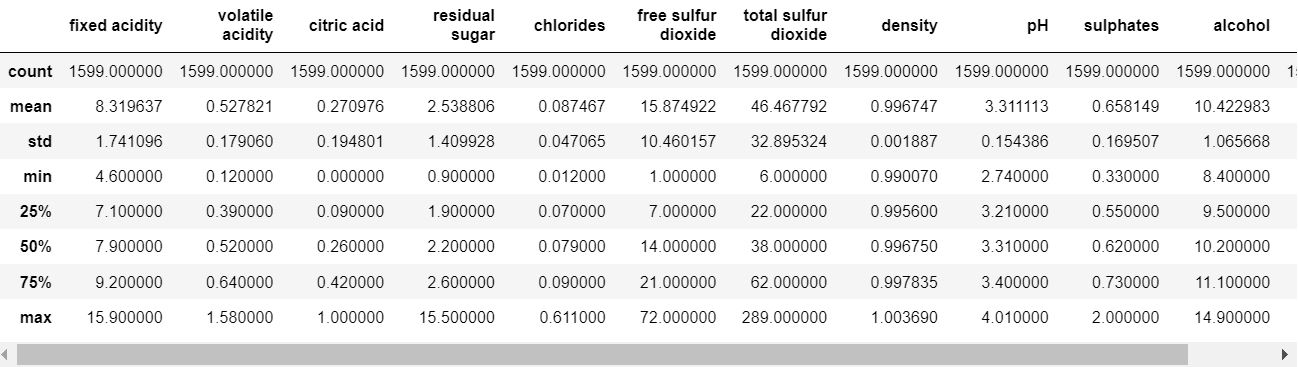
The first part of EDA the data frame is evaluated for structure, columns included and data types to get a general understanding for the data set. Get a summary on the data frame include data types, shape, and memory storage.
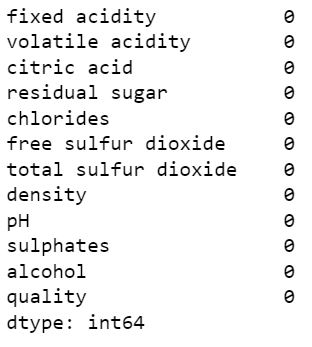
Lets check the missing value from the predictor, and there are no missing values and all the predictor variables are numerical.
Get statistical information on numerical features.
Exploratory Data Analysis
Acids
Acids constitute a significant wine constituent, and they contribute significantly to its taste. In fact, acids impact the sourness or tartness, which is a fundamental feature of the wine. The most abundant of these acids arise in the grapes themselves and carry over into the wine. However, some acids arise as a result of the fermentation process. (Nierman, 2004)
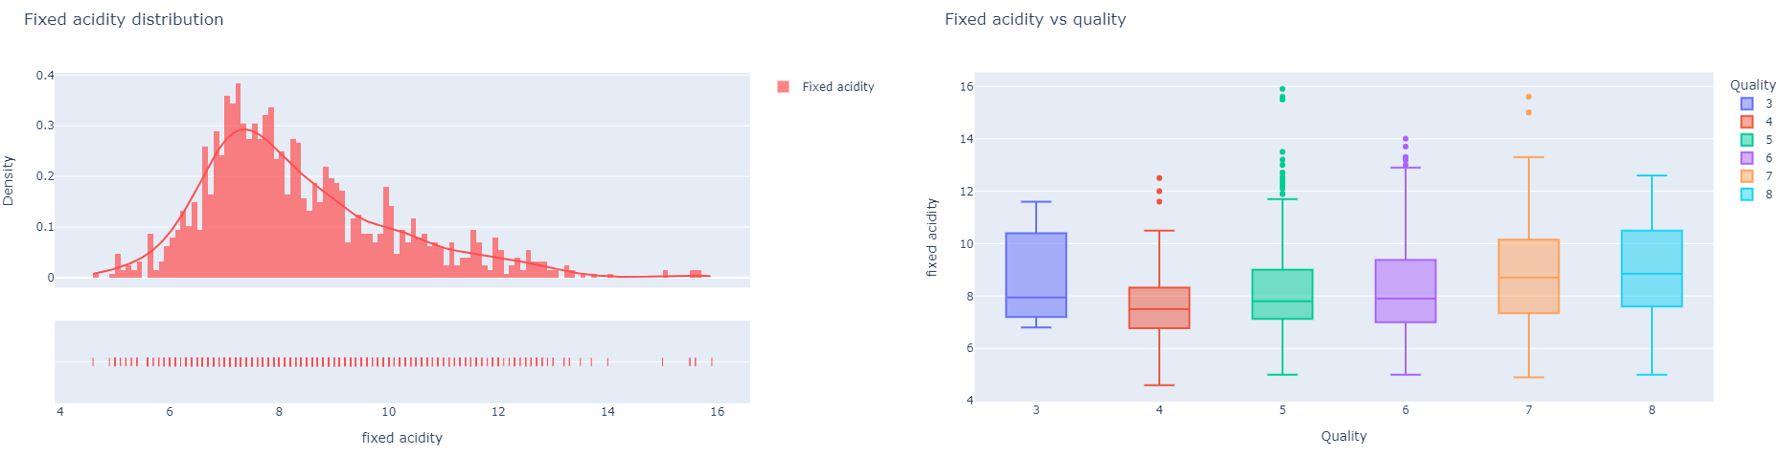
The predominantly fixed acids found in wines are tartaric, malic, citric, and succinic. The intensity of each acid can vary but according to this analysis, we can see that high-quality wines have somewhat higher fixed acidity levels. In a high quality wine the fixed acidic levels higher than 8g/L but less than 13g/L..
Volatile Acidity
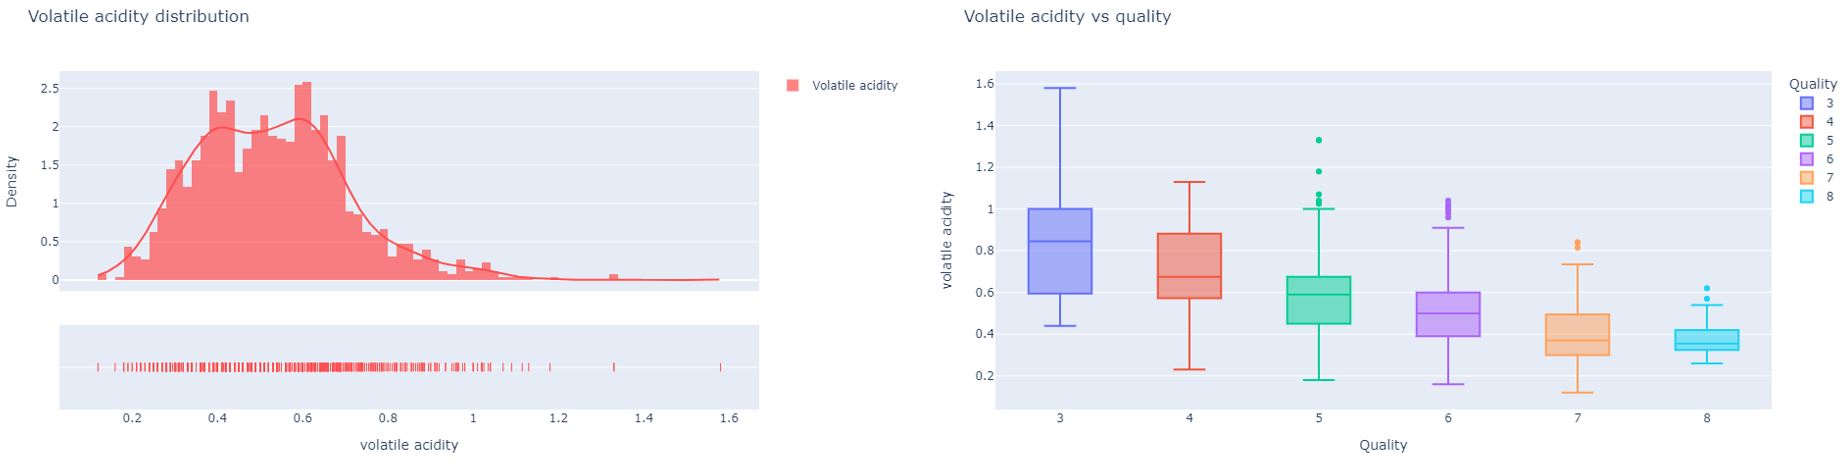
Volatile acidity (VA) is a measure of the wine's volatile (or gaseous) acids. The primary volatile acid in wine is acetic acid, which is also the primary acid associated with the smell and taste of vinegar.Therefore, this can be referred to as an unpleasant characteristic of wine. VA can be caused by several acids, but the primary source is Acetic Acid and is the result of bacteriological infection through oxidation during winemaking. In quantities of 0.2 to 0.4 g/L, volatile acidity does not affect a wine's quality. It is clear from the analysis that extreme volatile acidity levels can be pursued as a characteristic that affects the quality of the wine.This is because, extreme volatile acidity signifies a serious faultin wine, and can be referred to as volatile. But VA can give the wine a sharp, vinegary tactile sensation as well. A high quality wine has VA level at an average between 0.3-0.5g/L.
Citric Acids
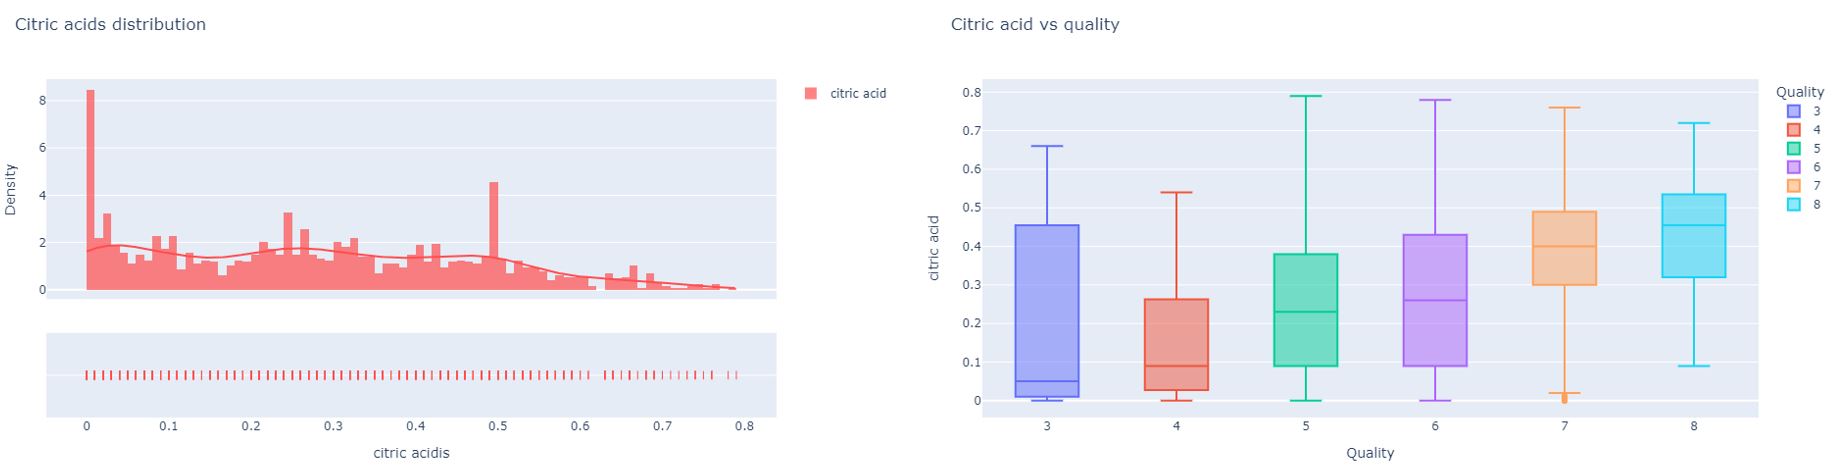
Citric acid is one of the less commonly found acids in wine. This acid is a weak organic compound that is commonly found in large quantities in citrus fruits like oranges and limes. Even though the quantity of citric acid found in grapes is small, it still makes up 5% of the total acid content in the fruit. Citric acid is most used as an acid supplement during the fermentation process to help winemakers boost the acidity of their wine especially grapes grown in warmer climates. Adding citric acid will give the wine “freshness”. Therefore, In a high quality wine bottle the citric acid level would be at an average level between 0.3-0.6 g/L.
pH Level
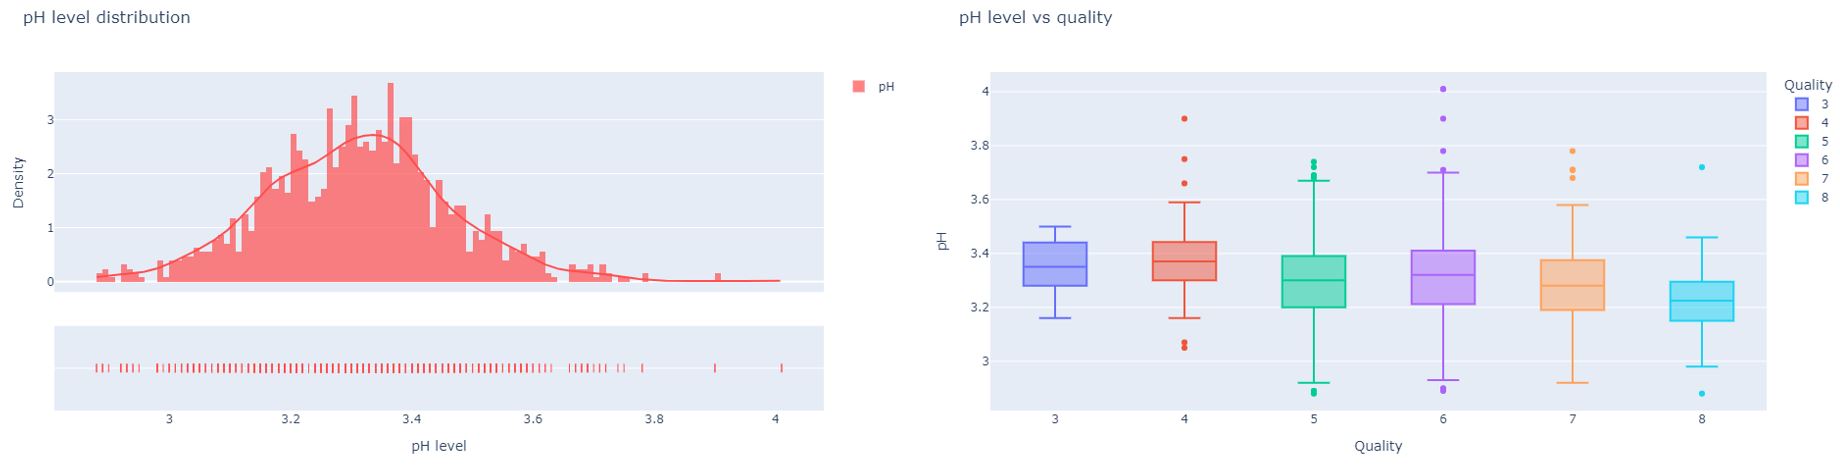
The below depiction and the analysis of each acid constituent indicated that high acidity is a unique feature of highquality wine. On top of that, high acidity allows the wine to improve with age. Therefore, considering the above facts,a pH value of 3.20-3.30 would be ideal for high quality wine. This will in turn allow the wine to have a crisper and tart taste than a low acidic wine which has a smoother rounder feeling.
Residual sugar
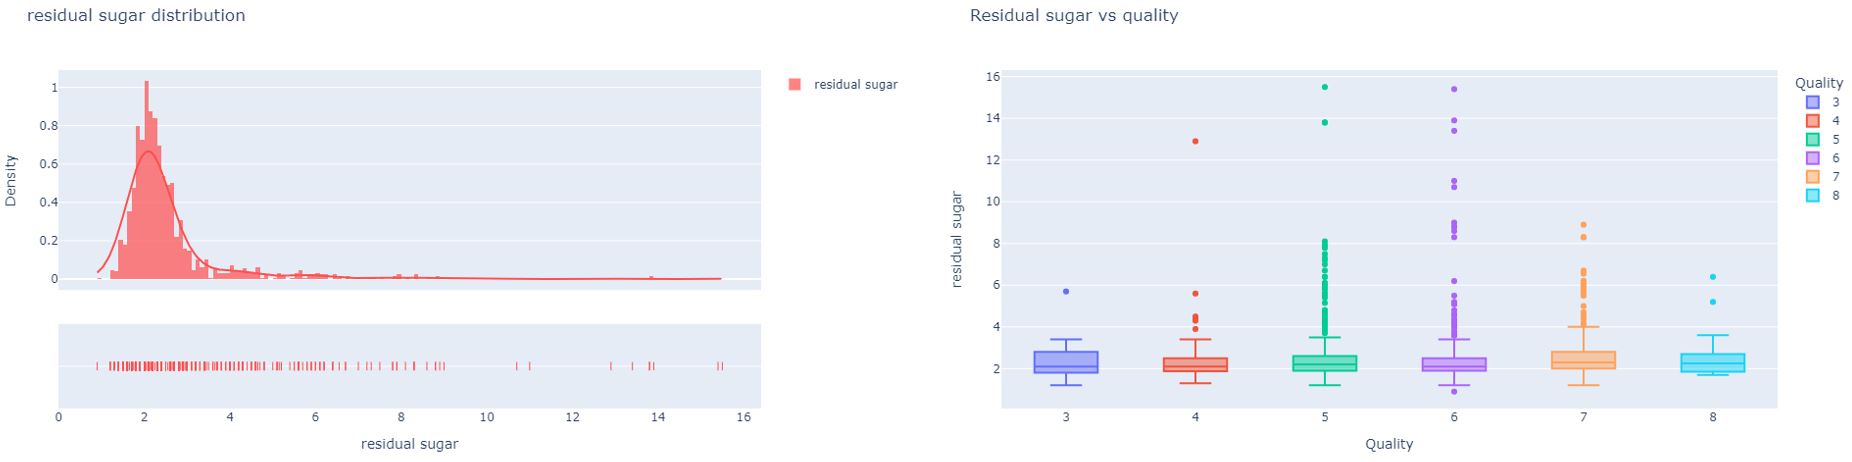
Residual sugar refers to the sugars left unfermented in a finished wine. The amount of residual sugar affects a wine’s sweetness and, in the EU, the RS level is linked to specific labeling terms. For example, a wine containing more than 45 g/L is a ‘sweet wine’. At a certain level, residual sugar may help a sharp, acidic wine to taste mellower and also make a plain wine more flavorsome. Some everyday wines are made by simply adding sweeteners, such as preserved grape juice to dry wines before bottling to make them more palatable. However, residual sugar can also be a dangerous enemy to the stability of a still wine because it may trigger re-fermentation in the bottle. Microbes may feed on the sugars left in the wine and generate unwanted flavors and gasses. From the analysis, we can see that very low-quality wines have a high amount of residual sugar. Even though residual sugars do not have a drastic effect on the quality of wine it is better to have a level below 2.5g/L.
Chlorides
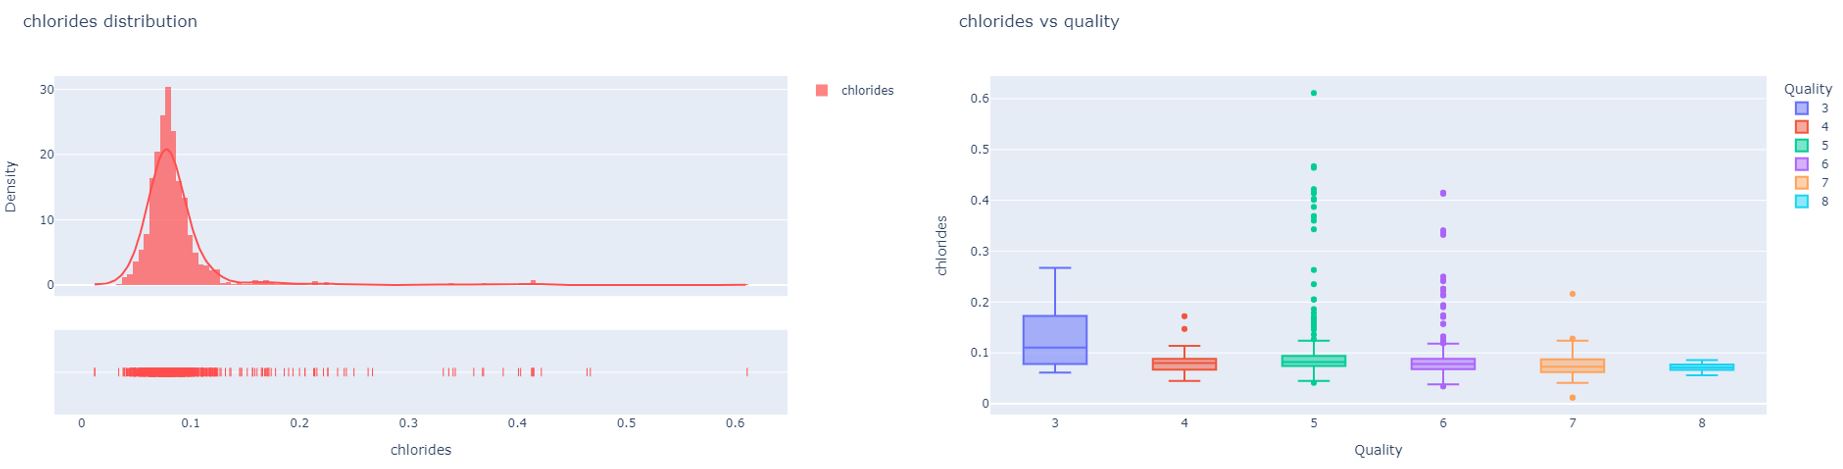
Chlorides are the amount of salt in the wine. They are used to help adjust acidity and taste. The study shows that chlorides and quality appear to have a negative relationship with red wine. This means high-quality wine contains less salt. Taking this fact from the analysis into consideration we can say that the chloride level between 75 mg/L to 80 mg/L is good for high quality wine.
Sulfites
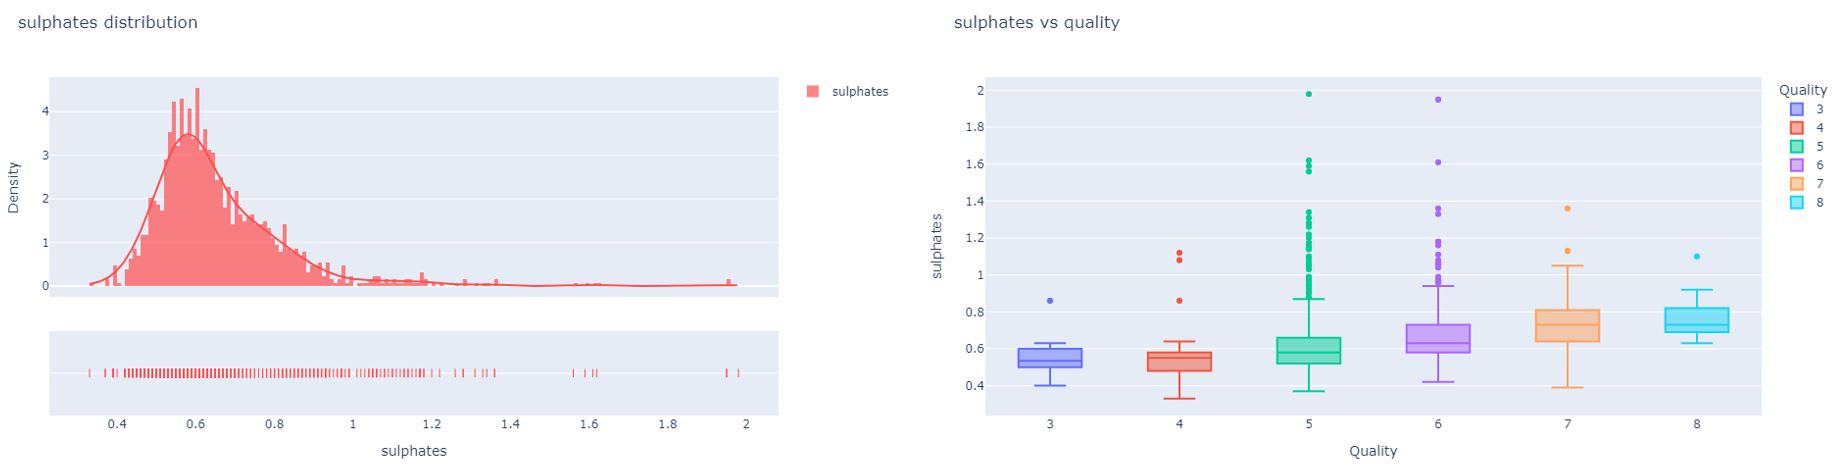
Sulfites are a group of chemical compounds found naturally in a variety of foods and beverages. They are artificially added as a preservative. Winemakers often use sulfites to help to minimize oxidation in wine and maintain its freshness. This in turn improves its taste and appearance. Medical research shows that a small percentage of the population is sensitive to sulfites and may experience side effects like headaches, hives, swelling, stomach pain, and diarrhea. Also, for those with asthma sulfites may cause irritation in the respiratory tract (Healthline, 2019). However, wine usually contains a range from 5 mg/L to 200 mg/L sulfites and a well-made dry red wine typically has about 50 mg/L sulfites. From the analysis, it’s clear that high-quality wines maintain a level of 50 mg/L of sulfites.
Sulfur Dioxides

Apart from sulfites, in winemaking, sulfur dioxide is added to control the process and serves many useful functions. For example, it acts as an enzyme inhibitor in musts to prevent the juice from browning. As a microbiological control agent, sulfur dioxide is added to the winemaking process to prevent oxidation in the finished product. Sulfur dioxide can be found in wine in its free forms, SO2 (gas) and bisulfite ion (HSO3–), or bound to compounds that incorporate a carbonyl group, such as acetaldehyde. Free forms of SO2 are pH and temperature-dependent, and because of the acidic nature of wines, SO2 is usually present and measured as bisulfate ions (HSO3–). Results are reported as SO2. The European Union established a maximum permitted level of total SO2 in wine varying from 150 to 500 mg/L, which is dependent upon the sugar level of the product. This analysis has shown that the total sulfur dioxide has a maximum of 289 mg/L in high quality wines. Therefore, a total SO2 level within the range of 275-290 mg/L assures high quality.
Density
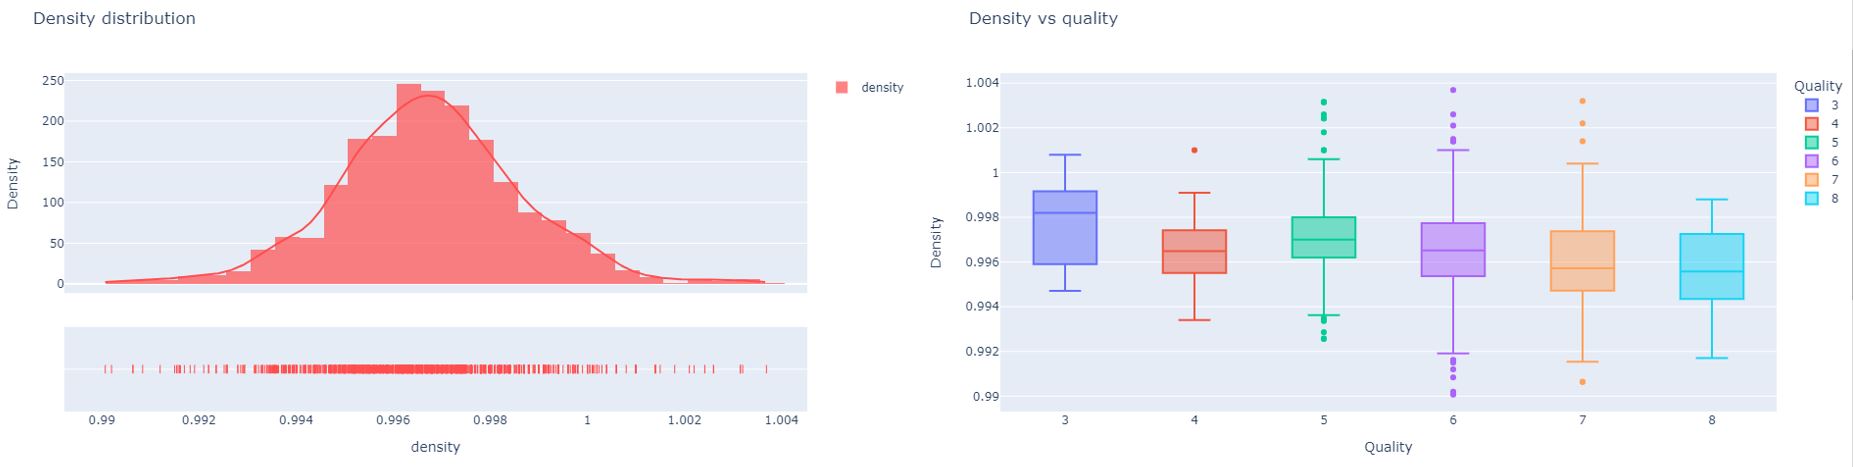
The density of the wine is inversely proportional to the quality. The primary reason can be stated as the addition of sugar, alcohol, and other ingredients to enhance the quality of the wine. These supplementary ingredients can cause the density of the liquid to drop. Therefore, taking the above finding into consideration the mean density of the wine at around 0.996435 g/cc will ensure a highquality product.
Alcohol Level
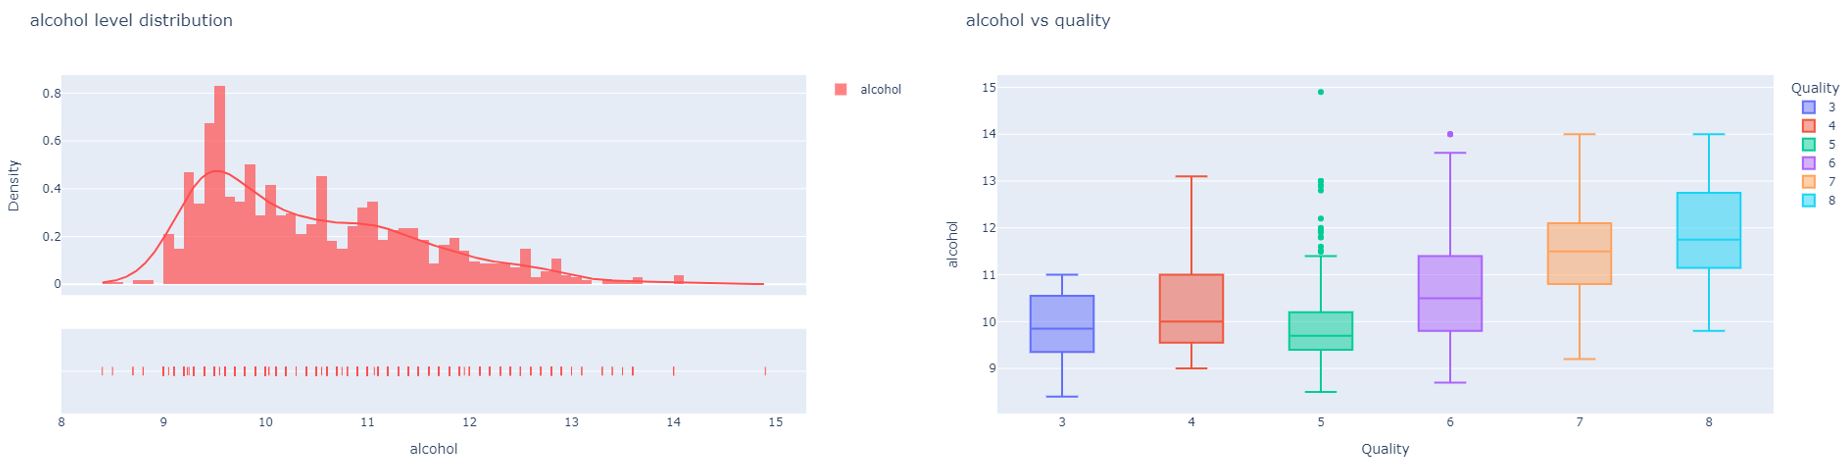
The wine flavor structure comprises a relationship between alcohol, acids, sugar, and tannin. For the best quality, all the above aspects need to have similar intensity. A wine with a higher alcohol content will have a fuller, richer body, while a lower-level alcohol wine will taste lighter and more delicate on the palate(Masterclass Staff, 2020). The depictions indicate that people appreciate a relatively high alcohol level in their wine ranging from an average of 10.4% to the upper quartile of 13.9%.Therefore, considering factual information and findings the alcohol level should be at 10.4% to 13.4% range.
Correlation analysis
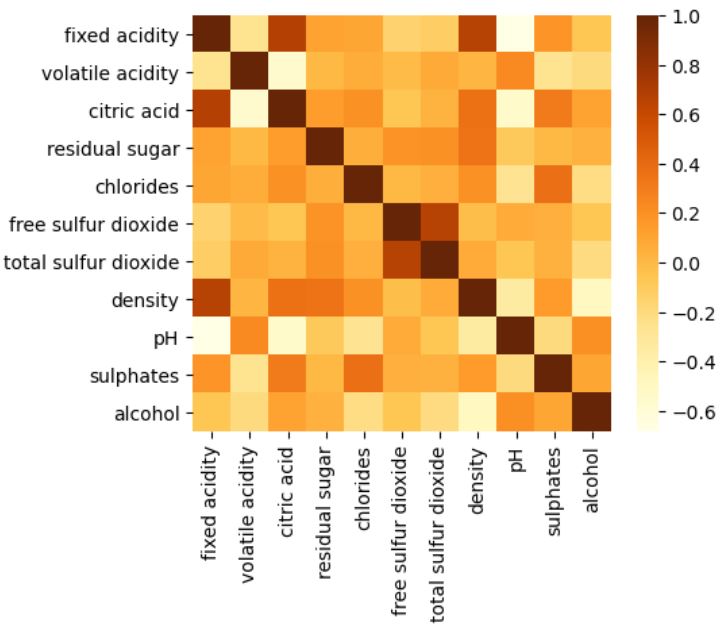
From the correaltion plot we can see there are some highly correlated variables.
Exploratory Data Analysis Conclusion
All features have shown an effect on the quality of the wine. When the correlation of each variable is considered, we can see that some features are correlated to each other. This is because features such as fixed acid, citric acids are part of features like pH value. The major findings are that acidity has had a major effect in determining the quality of the wine. Also, consumers have stated that a high-quality wine should not contain an excess of residual sugars. This means a very sweet wine is not a feature of high-quality wine. The increase in alcohol level has also been viewed as a feature of good wine but, it should not increase to an amount where the wine will be categorized as hard liquor.
Machine Learning
From the EDA, we have identified that some predictors are correlated. The predictors are on a ratio scale. The dependent variable is discrete with values stretching from 3 to 8. It is better to recode the response variable into few categories. It can be done as a binary classification as well as a multi class classification. Therefore, a tree-based approach will be the best option to tackle this problem and to create a classification model with high accuracy.
Therefore, a tree-based approach will be the best option to tackle this problem and to create a classification model with high accuracy. The objectives of this project is to experiment with different classification methods to see which yields the highest accuracy and to determine the effect of oversampling for classification accuracy.
df['quality'].unique()

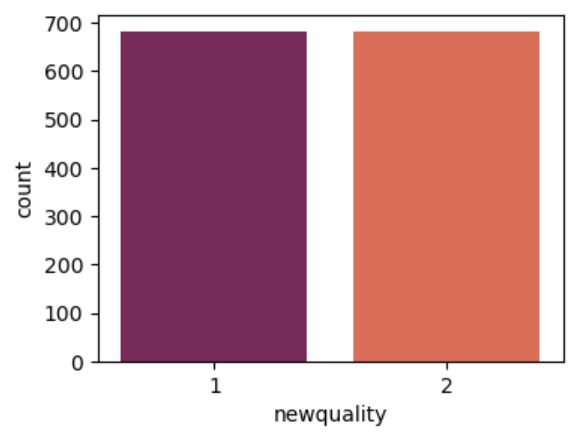
recoding the response variable to two categories as high quality and low quality.
new=[]
for row in df['quality']:
    if (row<=5):
        val=1
    else:
        val=2
    new.append(val)
df['newquality']=new
plt.figure(figsize = (4,3))
sns.countplot(df['newquality'],palette='rocket')
plt.show()

here we can see that dataet is not balanced. to overcome this problem we can use oversampling or undersampling. since low class have small number of observations here I am using oversampling techinque. in this analysis we are looking for prediction accuracy hence those correlations are neglected and also from the background study of red wines you can see that all the variables in this dataset are really important for final quality prediction.
X=df.drop(['quality','newquality'],axis=1)
y=df['newquality']
dividing the dataset into train and test sets
from sklearn.model_selection import train_test_split
x_train1,x_test,y_train1,y_test=train_test_split(X,y,test_size=0.20,random_state=1234)
Resampling with Oversampling Technique
from imblearn.over_sampling import SMOTE

oversample = SMOTE()
x_train, y_train = oversample.fit_resample(x_train1, y_train1)

plt.figure(figsize = (4,3))
sns.countplot(y_train,palette='rocket')
plt.show()
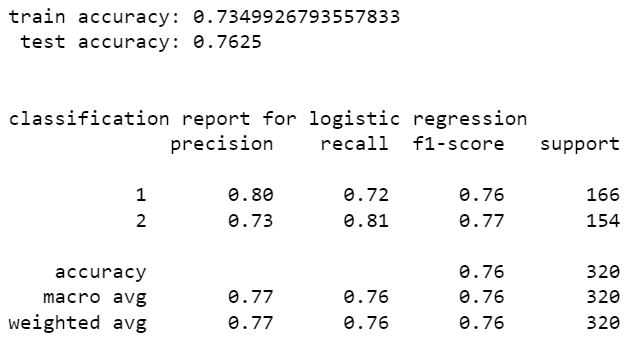
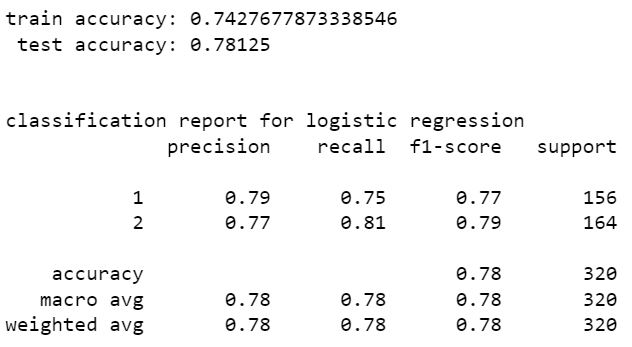
Logistic Regression
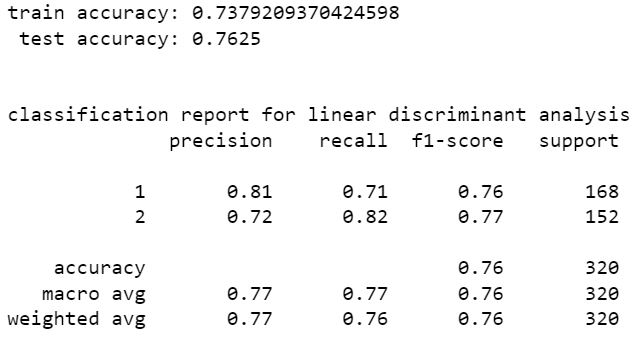
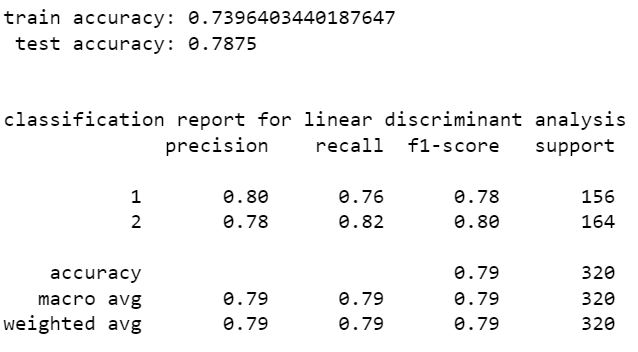
linear discriminant analysis
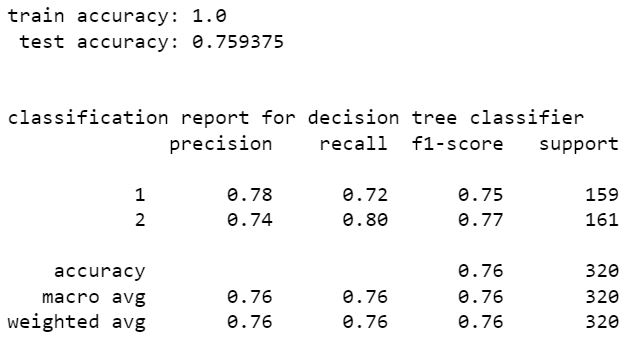
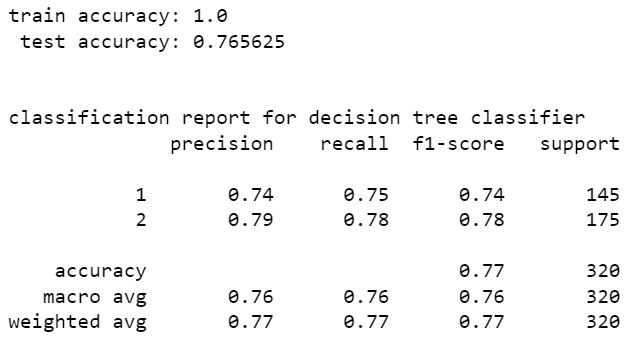
decision tree classifier
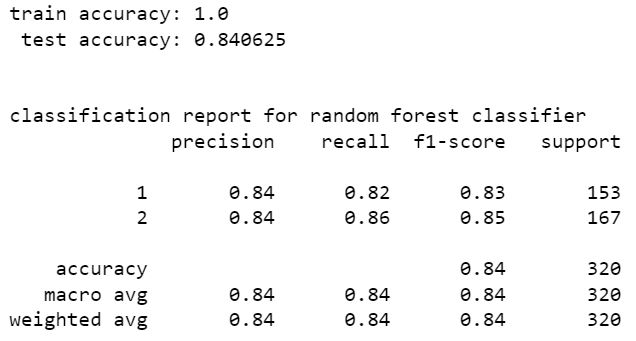
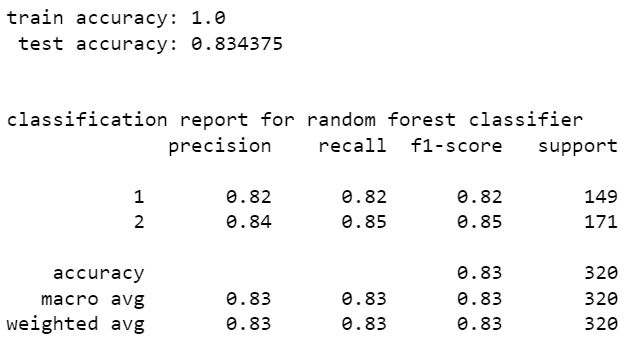
random forest classifier
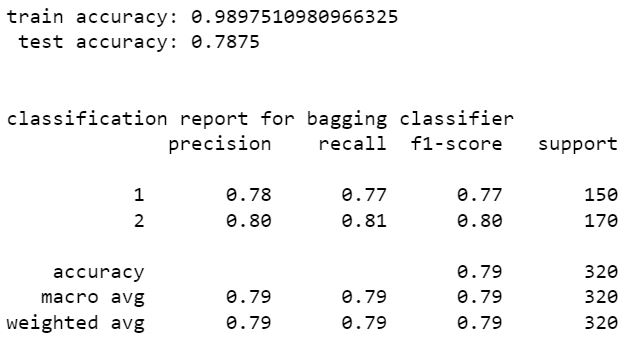
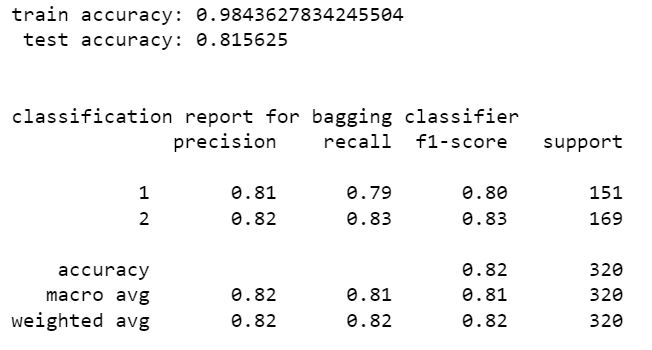
bagging classifier
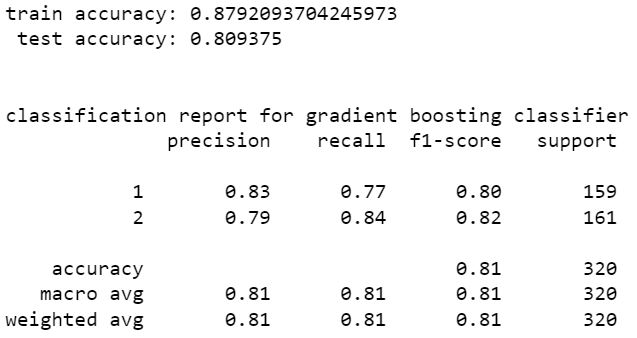
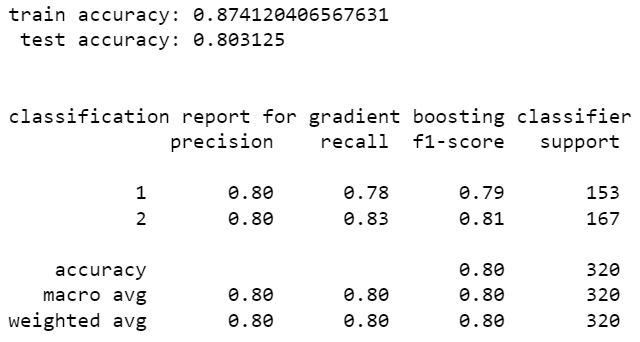
gradient boost classifier
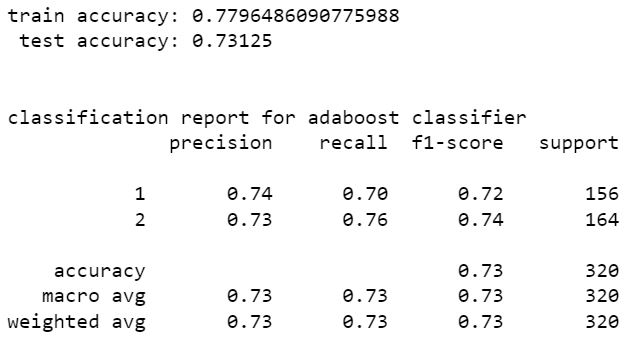
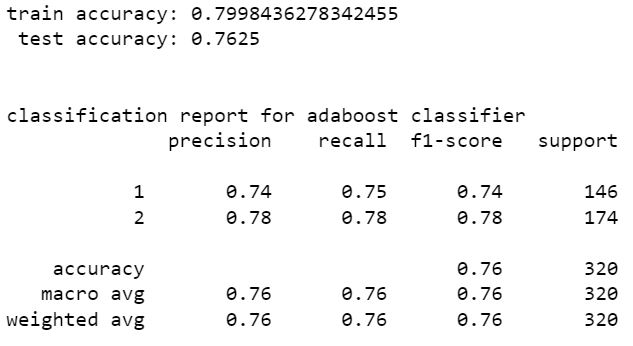
adaboost classifier
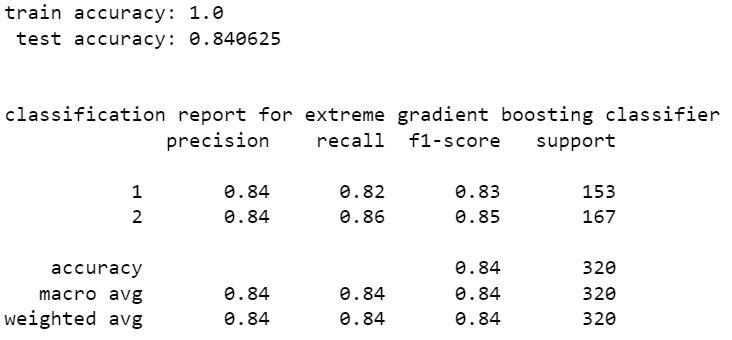
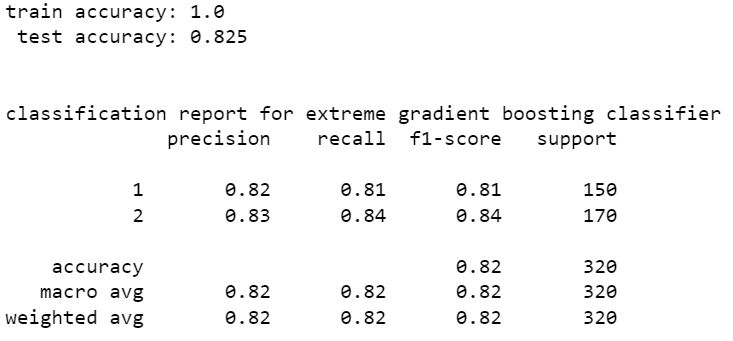
extreme gradient boost classifier
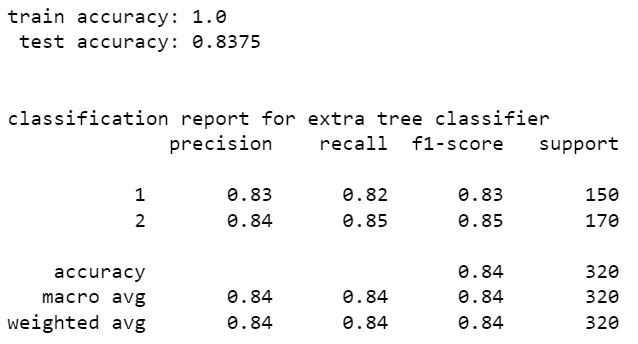
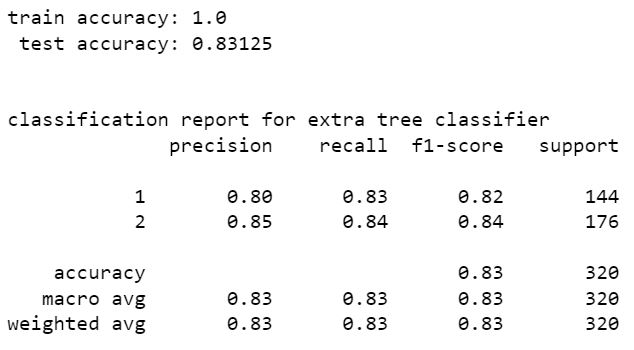
extra tree classifier
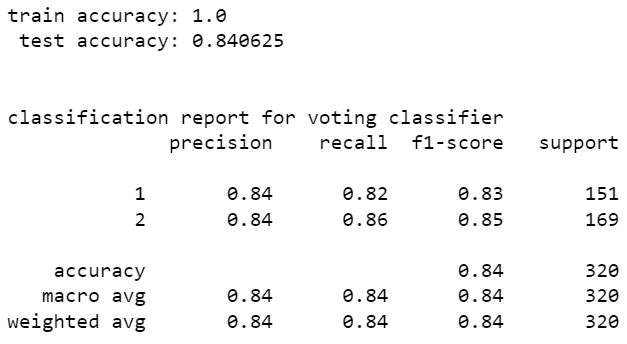
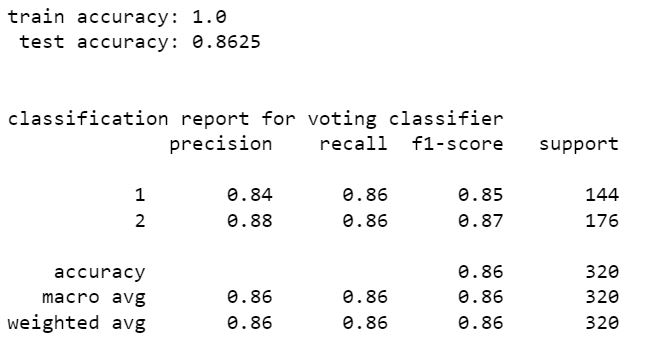
voting classifer
stacking classifier
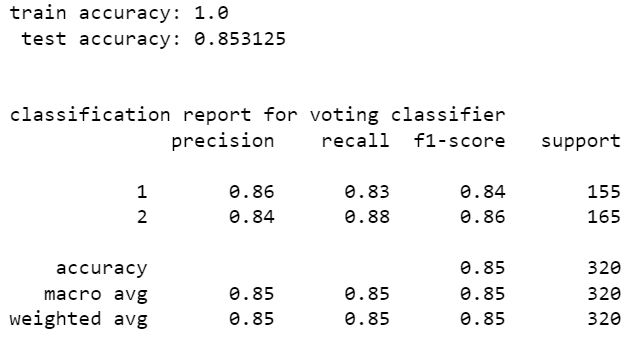
stacking classifier gives the highest accuracy which is 85.31%. precision and recall values are also high for this model. hence with SMOTE resampling the best model is stacking classifier with random forest classifier and extra tree classifier.
Model Without resampling
let's see accuracy values without using smote resampling technique
Logistic Regression
linear discriminant analysis
decision tree classifier
random forest classifier
bagging classifier
gradient boost classifier
adaboost classifier
extreme gradient boost classifier
extra tree classifier
voting classifer
stacking classifier
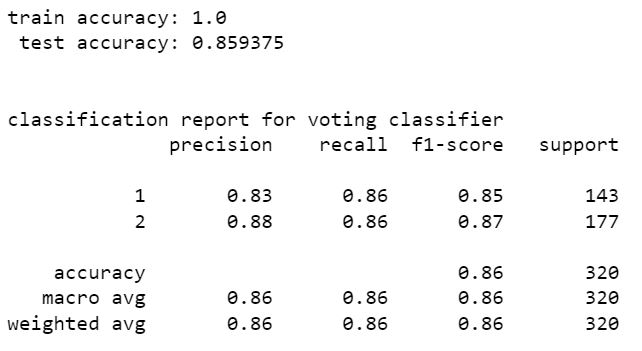
from the above models stacking classifier and random forest classifier have higher perfromance than other models. stacking classifier is the one with highest accuracy 85.94%. We can see that without resampling there is a slight increase in accuracy. hence the model without SMOTE resampling is the best one. The accuracy can be increased by tuning hyper parameters of these models using scikit learn randomized grid search.