Customer Personality Analysis

The most successful companies today are the one's who know their customers so well that they are able to anticipate their needs beforehand. This can better be achieved if we can segment the customers into different groups that reflect the similarities among the customers in each group. The goal of the segmentation is to foresee the needs of customers, get to know their interests, lifestyles, priorities and learn their spending habits so that to maximize the value of customers to the business. Customer segmentation has many advantages for the businesses which include:
For the given Dataset, I will perform the exploratory data analysis with the help of customer segmentation. Customer segmentation will be carried out with the help of K-Means alogorithm. At the end of analysis I would like to answer some questions by gaining some insights from the data, which are as follows:
Data Fields
People
Products
Promotion
Place
Import Package and Data
Started with imports of some basic libraries that are needed throughout the case. This includes Pandas and Numpy for data handling and processing as well as Matplotlib and Seaborn for visualization.
import numpy as np
import pandas as pd
from matplotlib import pyplot as plt
import seaborn as sns
import os

import plotly.express as px

%matplotlib inline
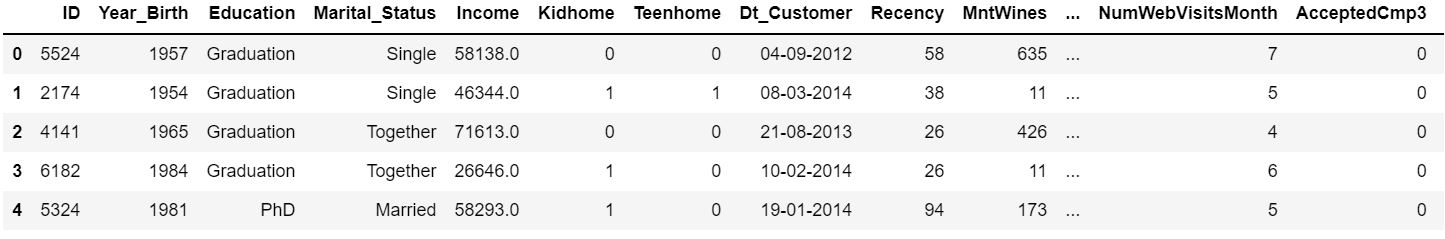
For this exercise, the data set (.csv format) is downloaded to a local folder, read into the Jupyter notebook and stored in a Pandas DataFrame.
customer = pd.read_csv('C:\My Files\Document\Coding\Datasheet\marketing_campaign.csv', sep='\t')
Data Preparation
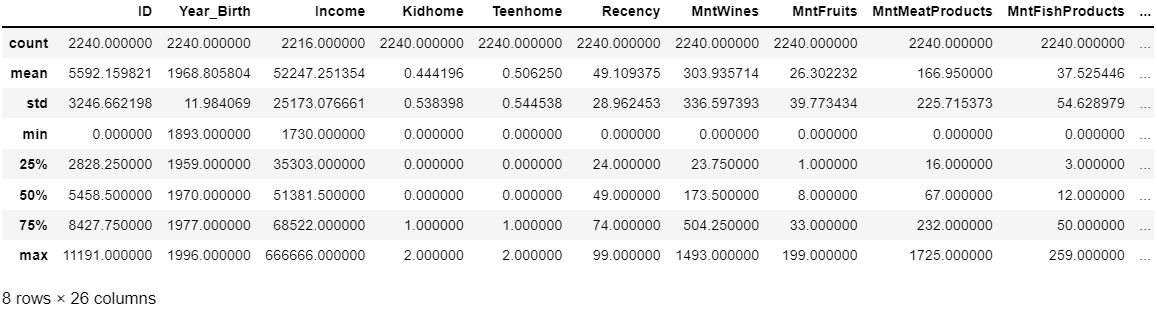
Get statistical information on numerical features.
Handle Missing Value
Lets check the missing value from the predictor.
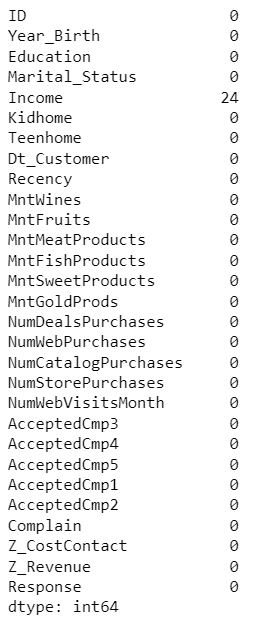
The Income column has some missing data. Let's drop the rows in the data with missing values.
Feature Engineering
There is a lot of information given in the dataset related to the customers. In some cases we can group some columns together to create new features and in some cases we can create new columns based on the existing one's to create new features. This would help to better explore the data and draw meaningful insights from it.
Age of Customers
Let's calculate the age of every customer from the birth year of customers. Since the customers enrollment with the company between 2012 and 2014, so we assume that the data was collected in January 2015 for the sake of simplicity.
import datetime as dt
customer['Age'] = 2015 - customer.Year_Birth
Months Since Enrollment
From the enrollment date of customers, let's calculate the number of months the customers are affiliated with the company.
customer['Dt_Customer'] = pd.to_datetime(customer['Dt_Customer'])
customer['Month_Customer'] = 12.0 * (2015 - customer.Dt_Customer.dt.year ) + (1 - customer.Dt_Customer.dt.month)
Total Spendings
The customer's spendings are given separately for different products. Let's sum them up to calculate the total spendings of the customers.
customer['TotalSpendings'] = customer.MntWines + customer.MntFruits + customer.MntMeatProducts + customer.MntFishProducts + customer.MntSweetProducts + customer.MntGoldProds
Age Groups
On the basis of Age let's divide the customers into different age groups.
customer.loc[(customer['Age'] >= 13) & (customer['Age'] <= 19), 'AgeGroup'] = 'Teen'
customer.loc[(customer['Age'] >= 20) & (customer['Age']<= 39), 'AgeGroup'] = 'Adult'
customer.loc[(customer['Age'] >= 40) & (customer['Age'] <= 59), 'AgeGroup'] = 'Middle Age Adult'
customer.loc[(customer['Age'] > 60), 'AgeGroup'] = 'Senior Adult'
Number of Children
Informationis given separately for kids and teens at home for every customers. Let's sum them up, as they can be better represented together as the number of children at home.
customer['Children'] = customer['Kidhome'] + customer['Teenhome']
Marital Status
The Marital Status column has different string values: Together, Married, Divorced, Widow, Alone, Absurd, YOLO. Most of them fall under the same category. So let's represent the marital status of customers based on 2 main categories i.e. Partner and Single.
customer.Marital_Status = customer.Marital_Status.replace({'Together': 'Partner',
                                                           'Married': 'Partner',
                                                           'Divorced': 'Single',
                                                           'Widow': 'Single',
                                                           'Alone': 'Single',
                                                           'Absurd': 'Single',
                                                           'YOLO': 'Single'})
Removing Outliers
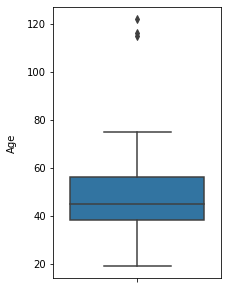
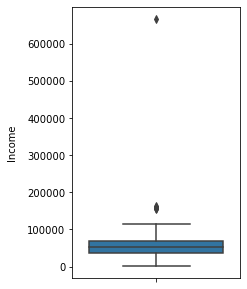
There seems to be some outliers in the Age and Income columns. Let's check them.
plt.figure(figsize=(20,10))
sns.boxplot(y=customer.Age);
plt.ylabel('Age', fontsize=20, labelpad=20);
plt.figure(figsize=(20,10))
sns.boxplot(y=customer.Income);
plt.ylabel('Income', fontsize=20, labelpad=20);
There are some customers aged above 100. This is unlikely to happen. Let's drop those customers from data.
There are some customers who are earning more than 120,000 and some of them even more than 600,000. They are clearly the outliers in the data, so we will leave them out.
Exploratory Data Analysis
Marital Status
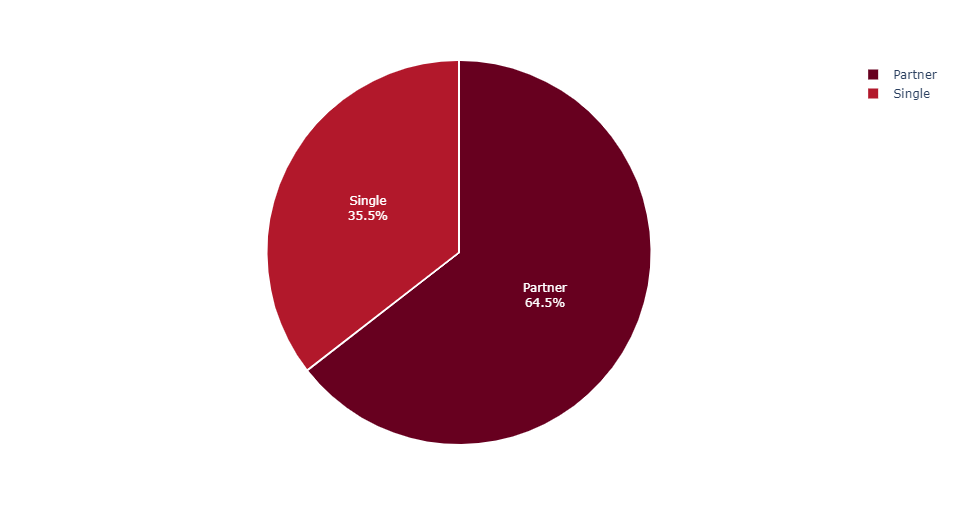
INSIGHT:
2/3rd of the customers are living with partners while about 1/3rd are singles
Average Spendings: Marital Status Wise
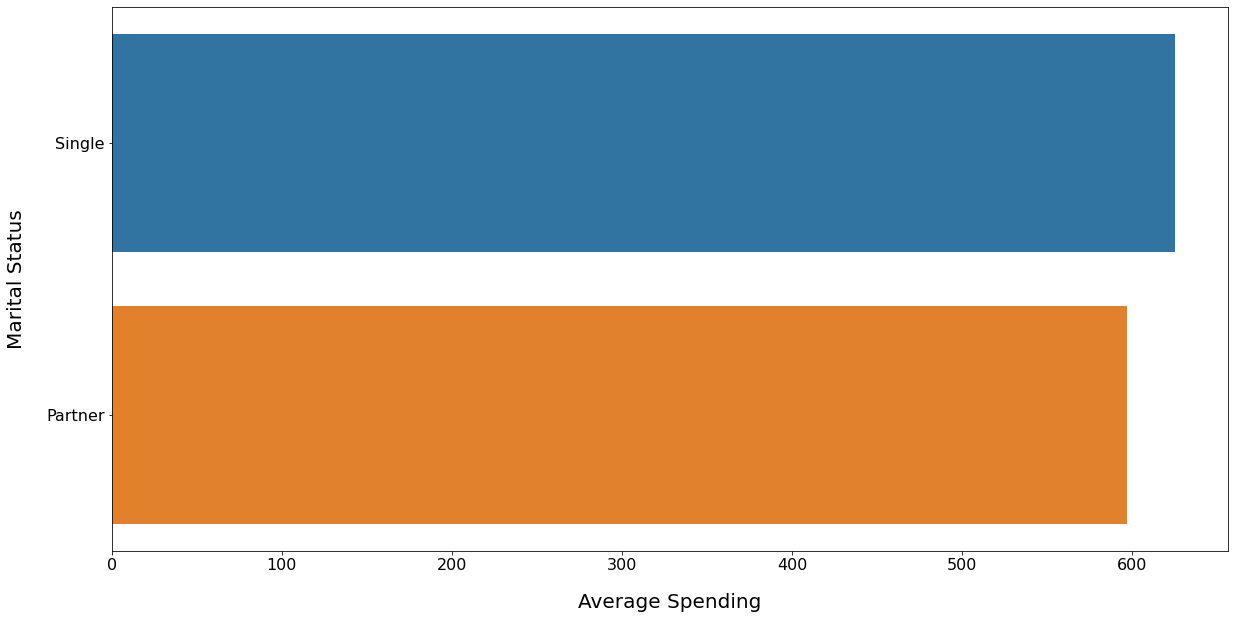
INSIGHT:
Despite being the minority, the Singles spent more money on the average as compared to the customers having partners
Education Level
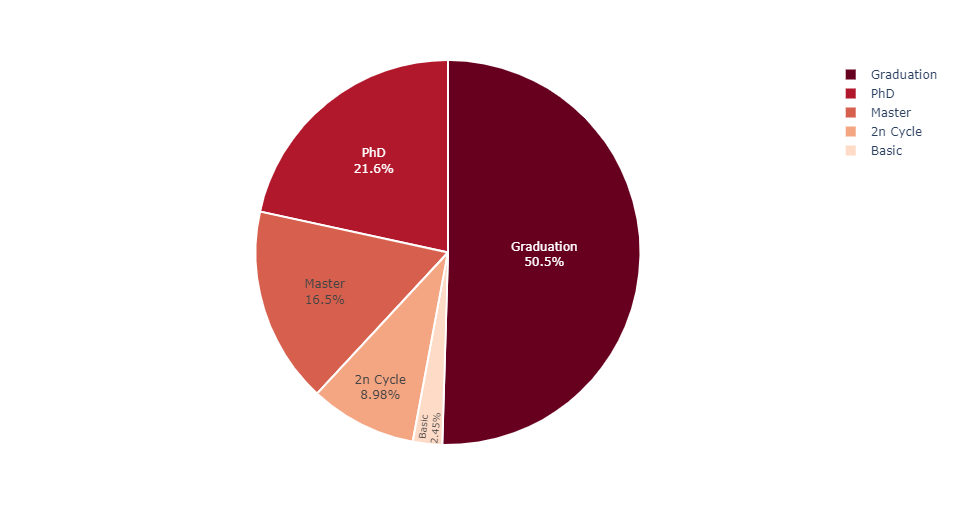
INSIGHT:
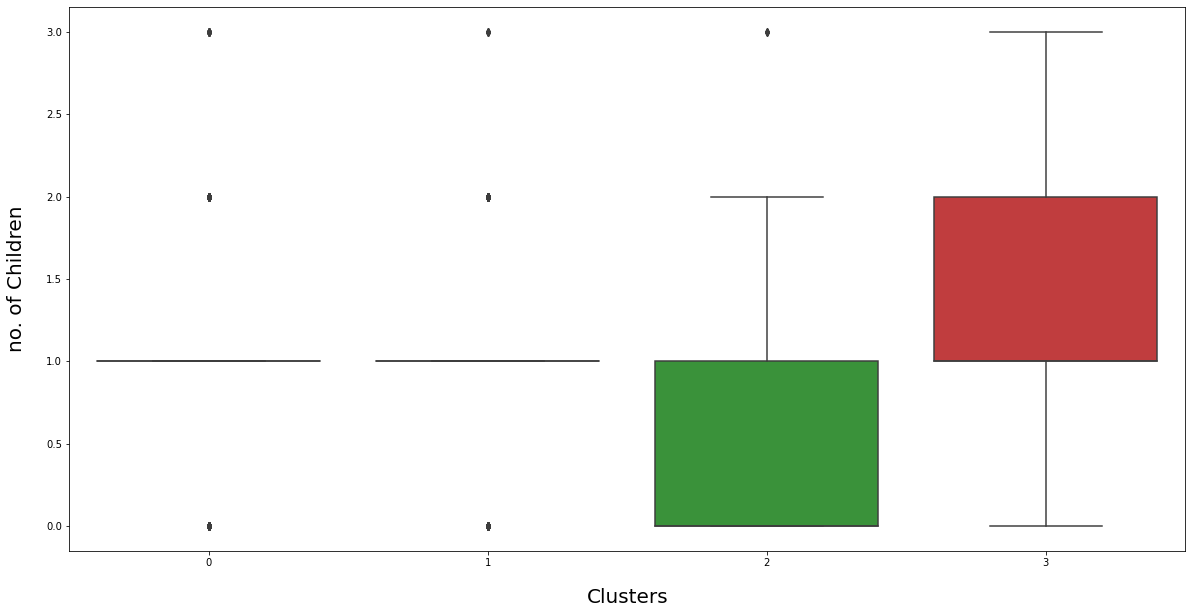
Child Status
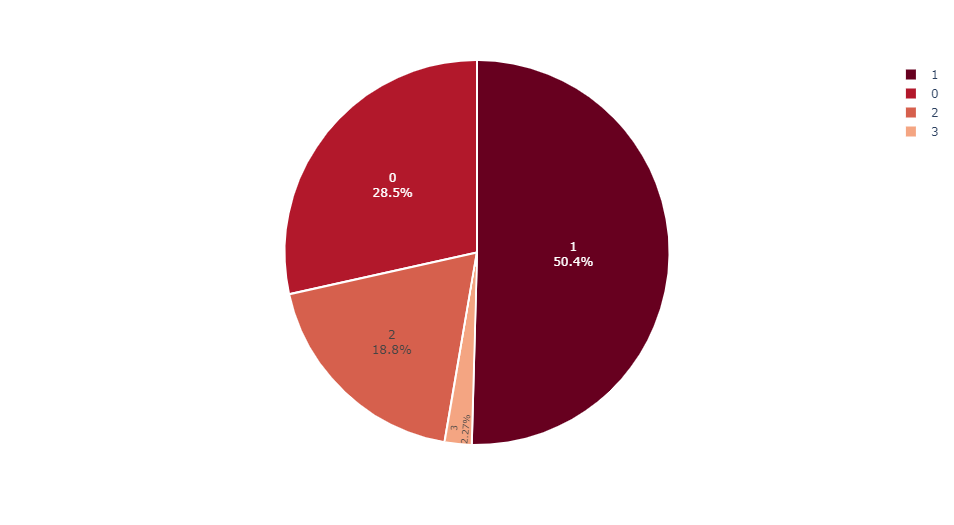
INSIGHT:
Average Spendings: Child Status Wise
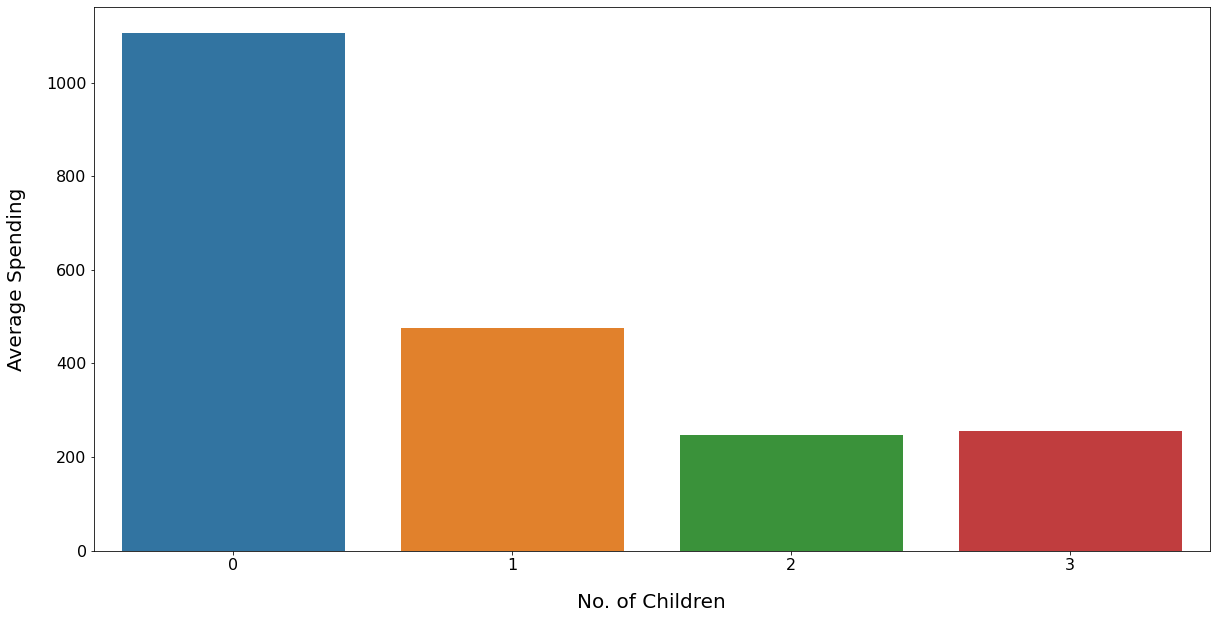
INSIGHT:
Age Distribution of Customers
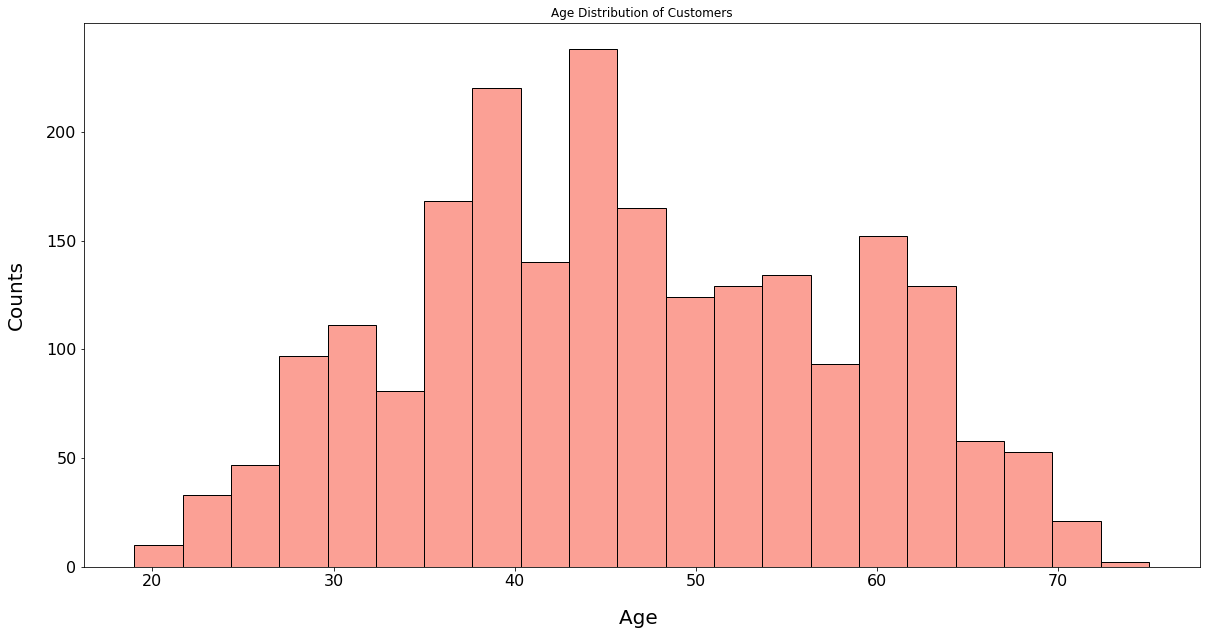
INSIGHT:
Age of the customers is nearly normally distributed, with most of the customers aged between 40 and 60.
Relationship: Age vs Spendings
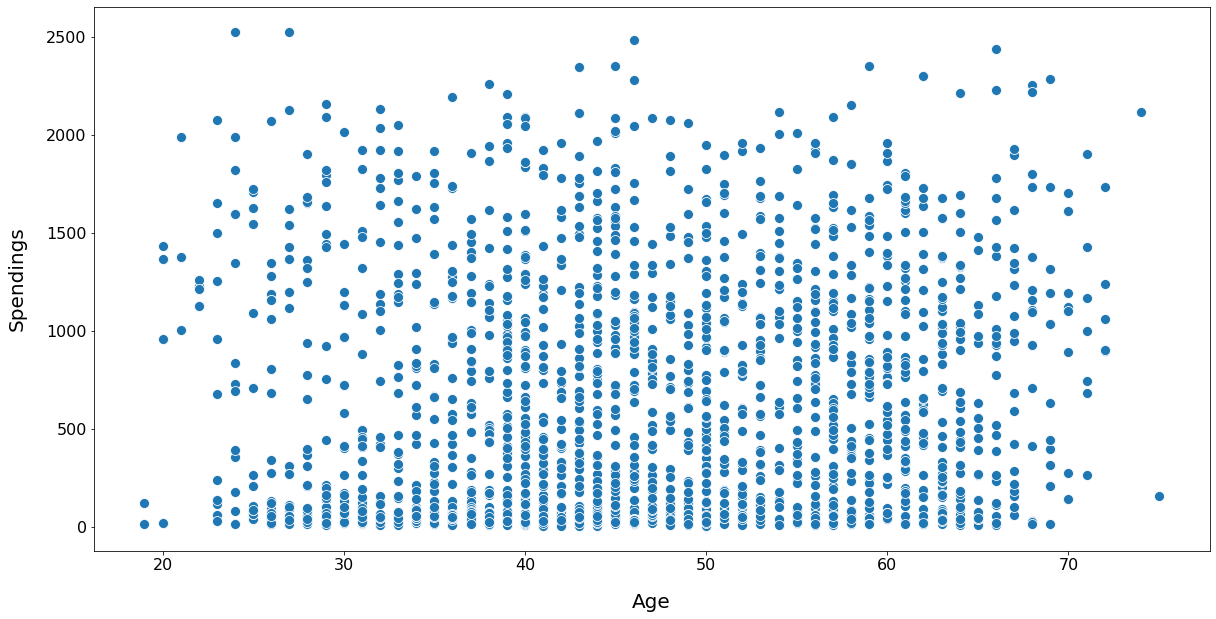
INSIGHT:
There doesn't seem to be any clear relationship between age of customers and their spending habits.
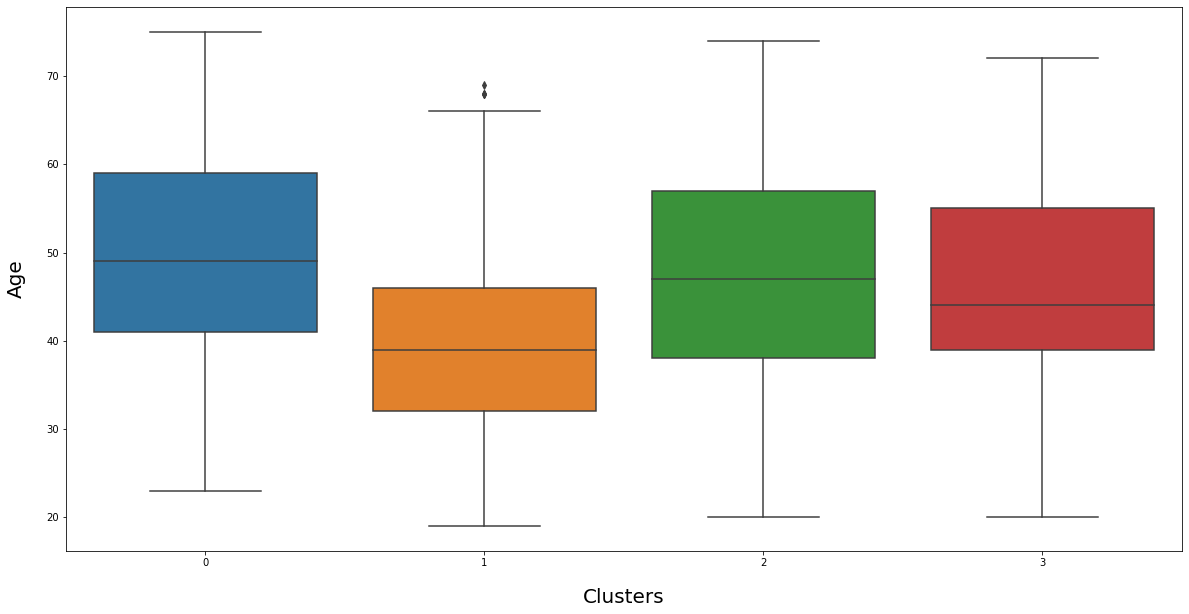
Customers Segmentation: Age Group Wise
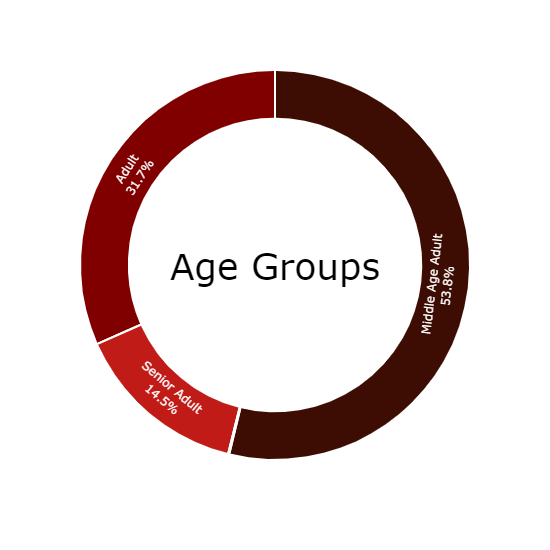
INSIGHT:
Average Spendings: Age Group Wise
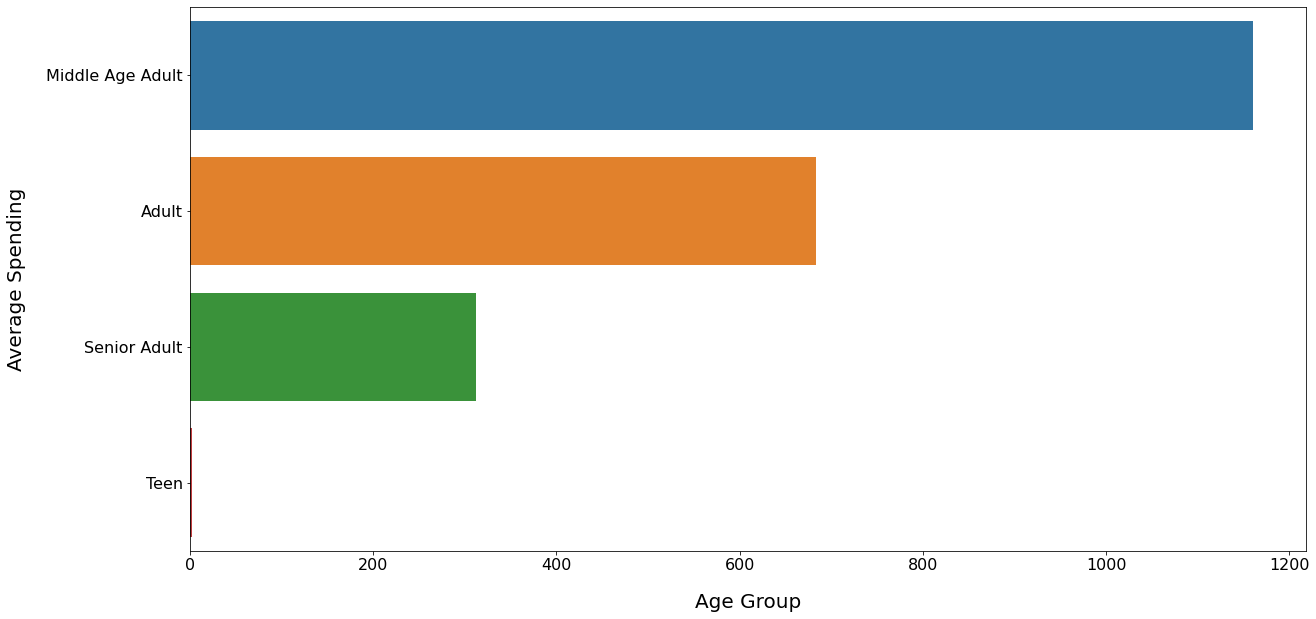
INSIGHT:
Middle age adults spent much more than the other age groups.
Income Distribution of Customers
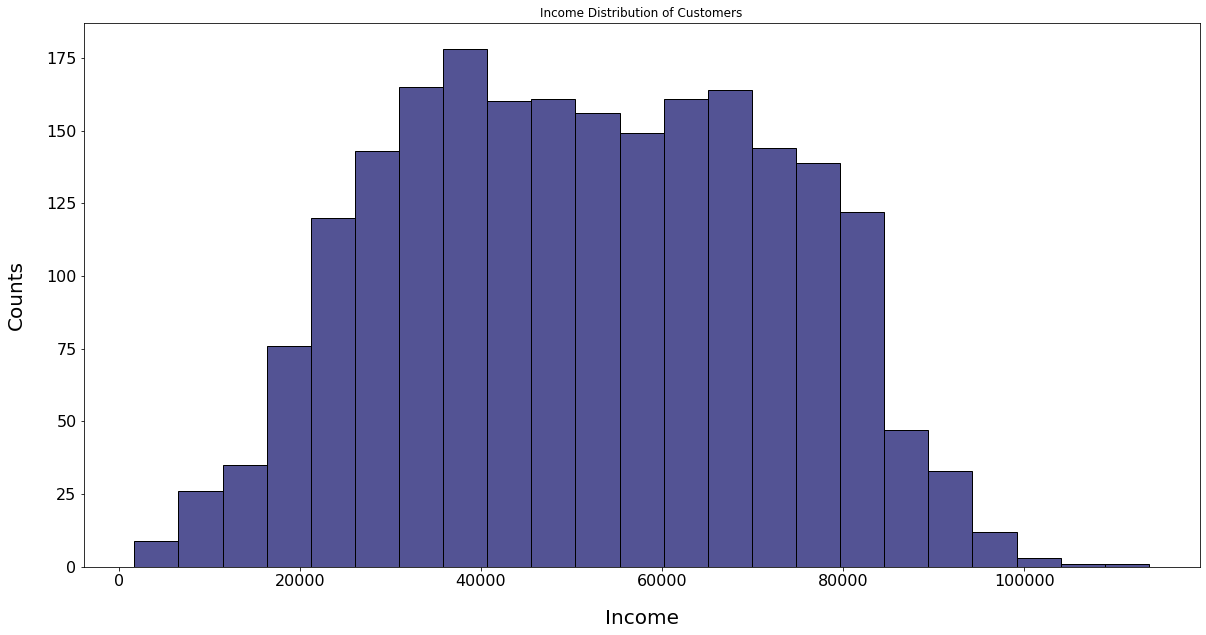
INSIGHT:
The salaries of the customers have normal distribution with most of the customers earning between 25000 and 85000.
Relationship: Income vs Spendings
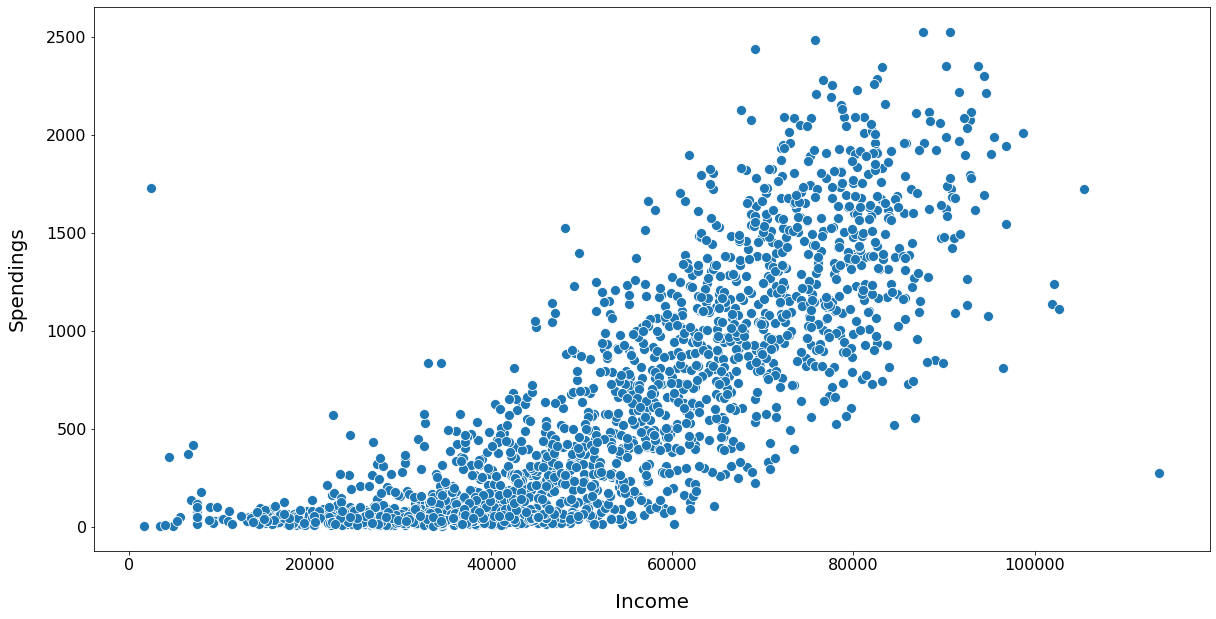
INSIGHT:
The relationship is linear. Customers having higher salaries are spending more.
Most Bought Products
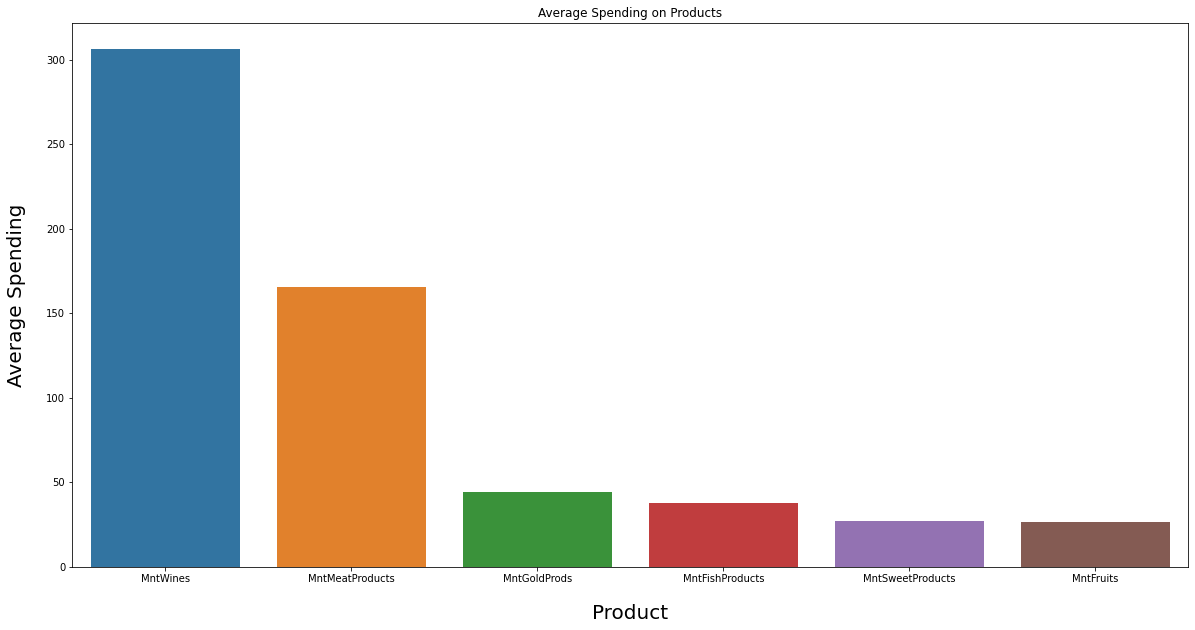
INSIGHT:
Machine Learning Model
Let's find out the different segmenst of the customers based on different features of the customers data using the K-Means Clusters. Let's first drop the unnecessary columns from the data.
Optimum Clusters Using Elbow Method
Let's choose the optimum number of clusters based on the Elbow method.
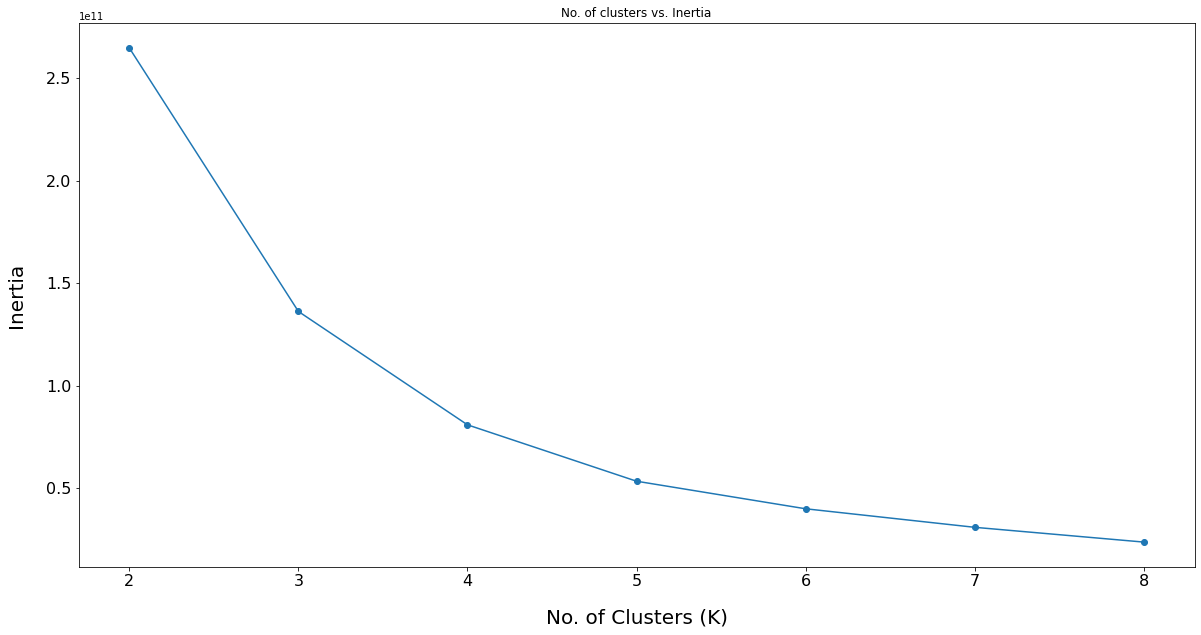
Based on the above plot we will segment the customers into 4 clusters, as the inertia value donot decrase much after 4 clusters.
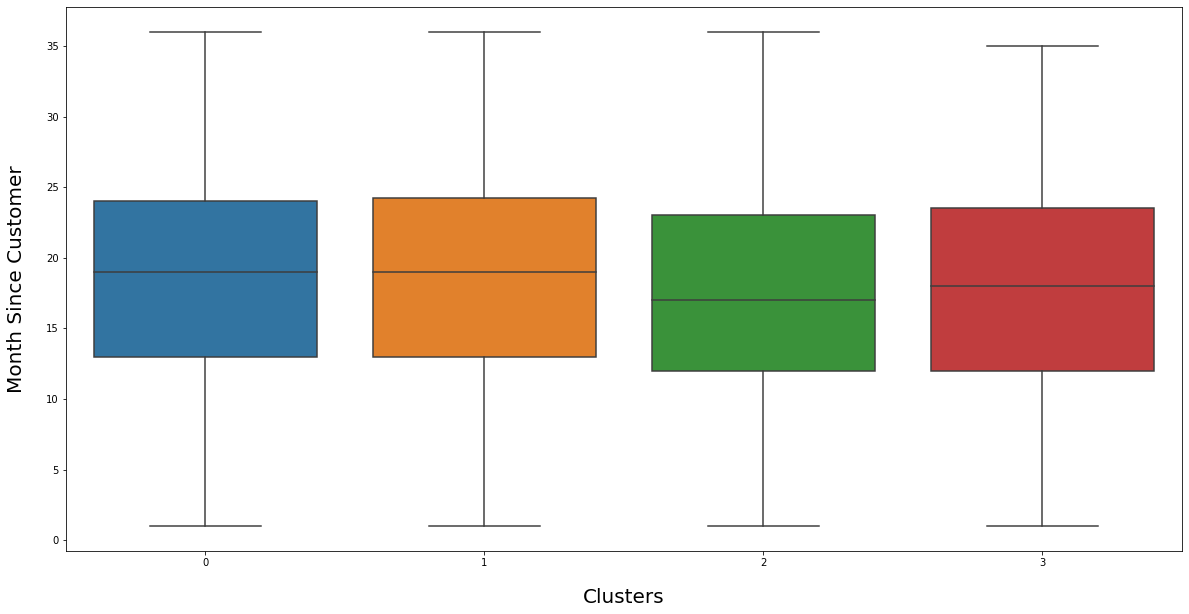
Clusters Identification
Let's try to identify the modelled 4 clusters from different features of the data
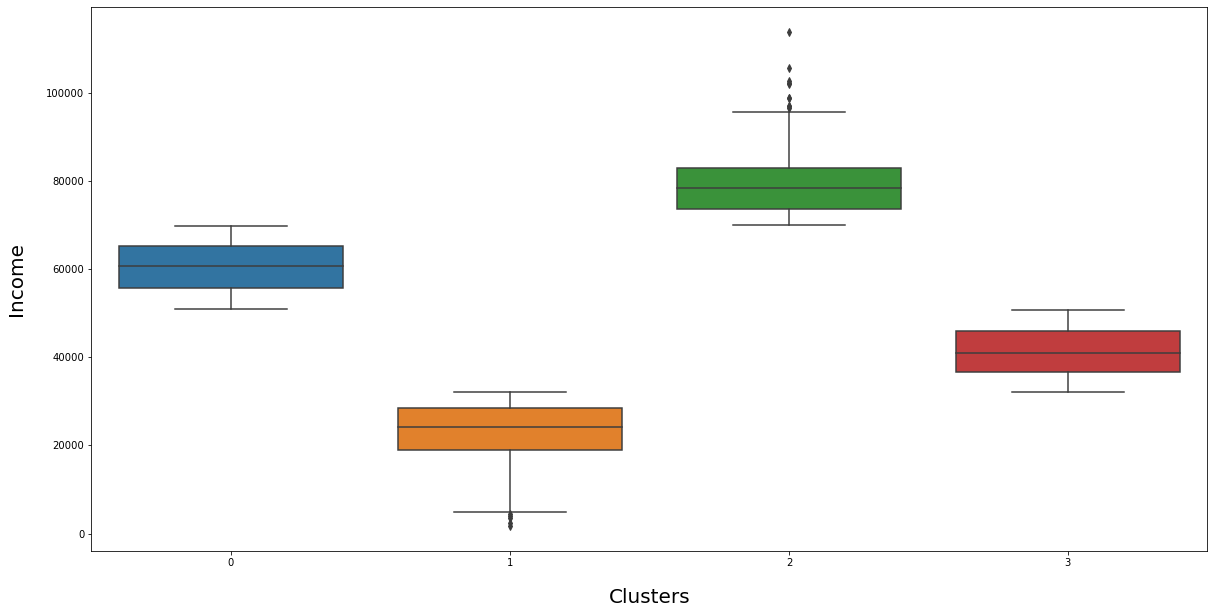
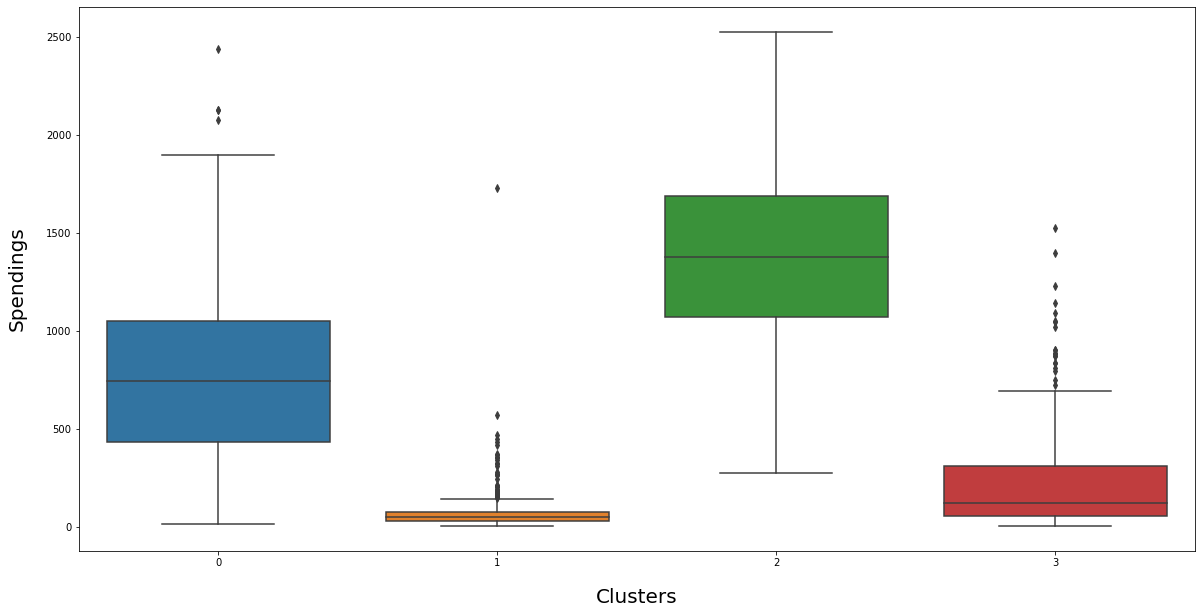
Clusters Interpretation
From the above analysis we can segment the customers into 4 groups based on their income and total spendings:
Data Exploration: Clusters Based
Let's explore the data again based on the modelled clusters to identify the spending habits of the customers
customer_kmeans.clusters = customer_kmeans.clusters.replace({1: 'Bronze',
                                                             2: 'Platinum',
                                                             3: 'Silver',
                                                             0: 'Gold'})

customer['clusters'] = customer_kmeans.clusters
Customers Distribution
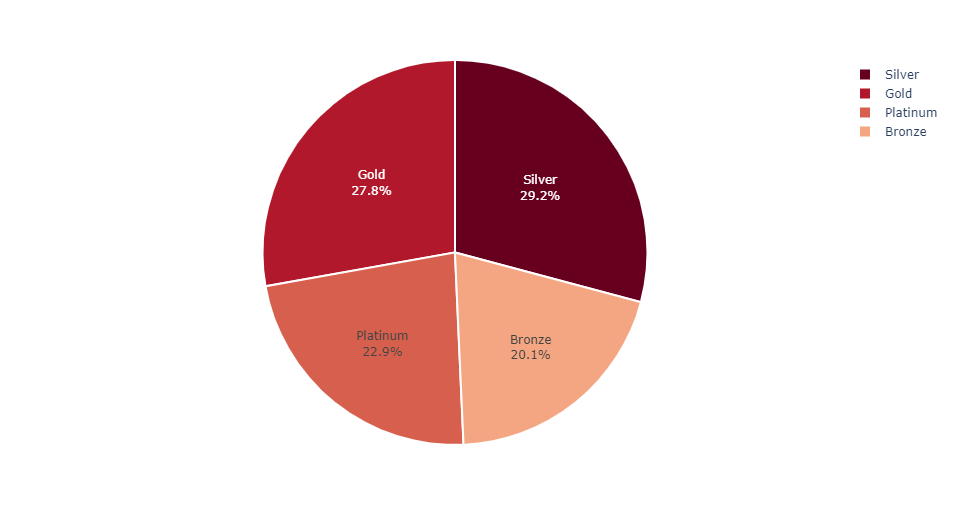
INSIGHT:
Relationship: Income vs. Spendings
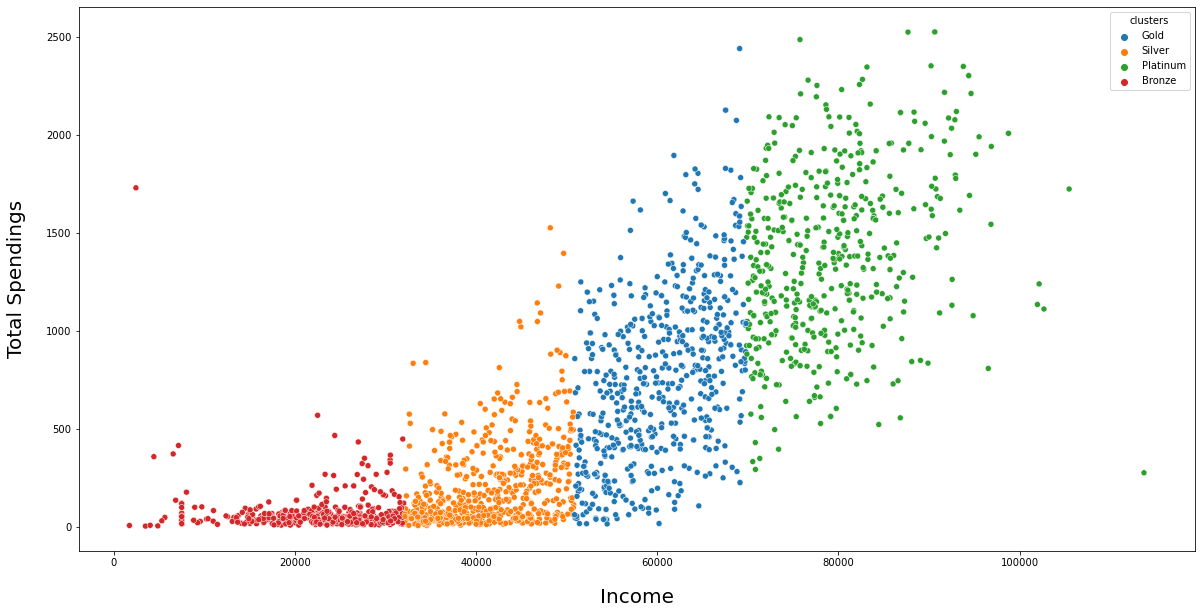
INSIGHT:
Spending Habits by Clusters
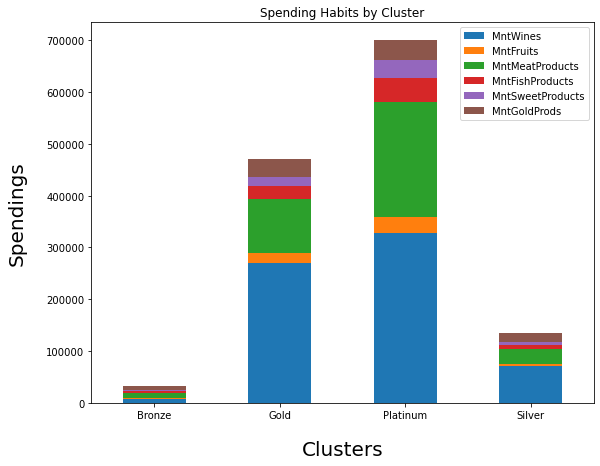
INSIGHT:
Customers from all the segments have spent most of their money on Wine and Meat products
Purchasing Habits by Clusters
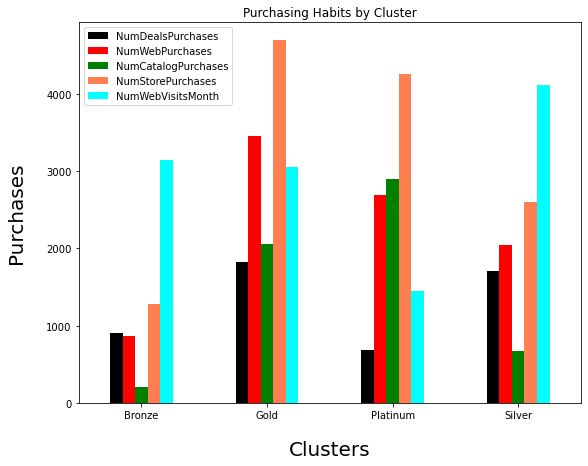
INSIGHT:
Promotions Acceptance by Clusters
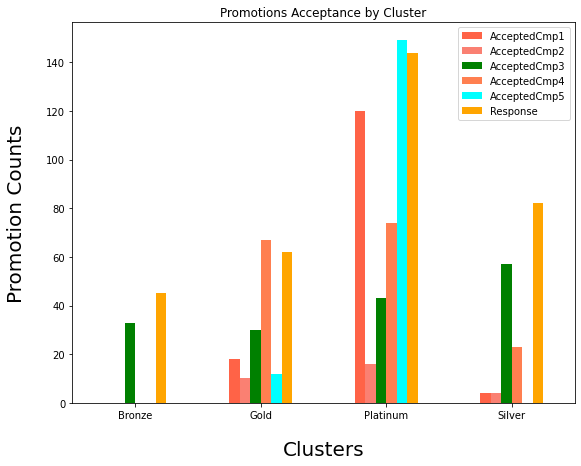
INSIGHT:
Conclusion
Answering Question
What are the statistical characteristics of the customers?
The company's customers are mostly married. There are more Middle Aged Adults, aged between 40 and 60 and most of them like to have one child. Most of the customers hold bachelor degree and their earnings are mostly between 25,000 and 85,000.
What are the spending habits of the customers?
Customers have spent more on wine and meat products. Those without children have spent more than those having children. Singles are spending more than the one's with the partners. Middle aged adults have spent more than the other age groups. Store shopping is the preferred channel for purchasing among the customers. Web and Catalog purchasing also have potential.
Are there some products which need more marketing?
Sweets and Fruits need some effective marketing. Company needs to run promotions for these products in order to increase the revenue from these products. Baskets of the least selling products combined with the most selling products can be effective.
How the marketing can be made effective?
As a marketing recommendation give coupons to the old and high spending customers. Market the cheap and on-offer products to the low income and low spending customers. Web purchasing has some potential. To unlock this give special discounts to the customers who sign up on company's website.