Pakistan Used Cars
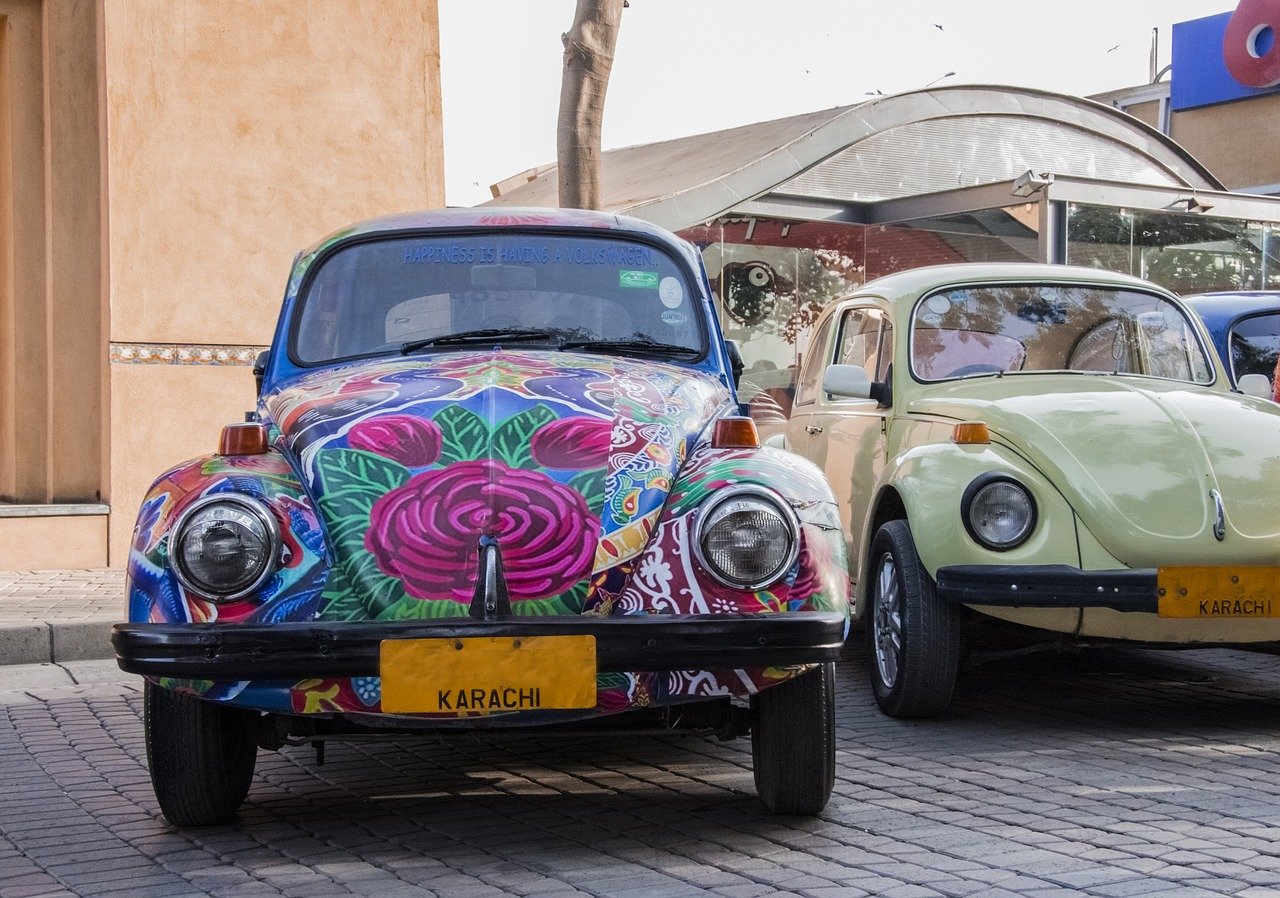
This dataset was collected for the research purposes and was uploaded on kaggle platform about 2 years ago. It contains information regarding the sale of mostly used cars in Pakistan along with their prices, year, model, brand, kilometers driven, registration information etc. The data was collected from differenet car selling websites in Pakistan. I would formulate some questions to gain deeper understanding of the data and bring some interesting conclusions from the data.
Import Package and Data
import numpy as np
import pandas as pd
import matplotlib.pyplot as plt
import seaborn as sns

%matplotlib inline
import plotly.express as px
For this exercise, the data set (.csv format) is uploaded to my repository github, read into the Jupyter notebook and stored in a Pandas DataFrame.
Data Preparation and Cleaning
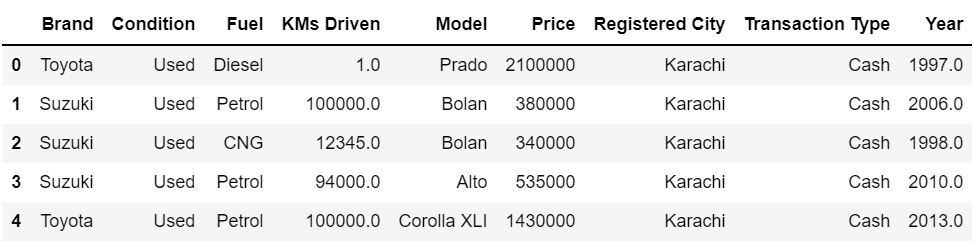
As a first step, the data will be cleaned. Columns with missing values will be identified and then the missing values will be handeled. By displaying the dataset we can quickly recognize that there are 24973 rows and 9 columns in the dataframe
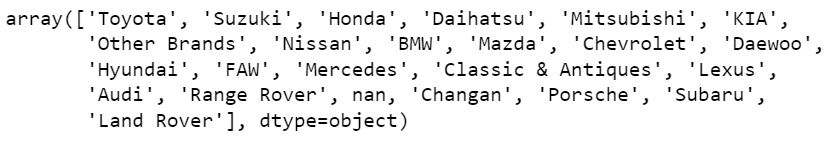
By displaying the unique values from Brand column of dataset, we can see that the cars from 23 different brands are being dricven in Pakistan. The dataset also contains NAN values, which means that for some cars the brand information is missing. The missing values will be handed later.
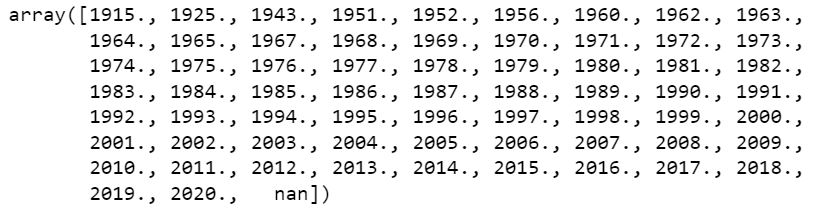
By sorting the unique values from the Year column, it is infered that the dataset contains the information for car models from 1915 till 2020. The release year for some cars is missing as the array also conatins NAN values.
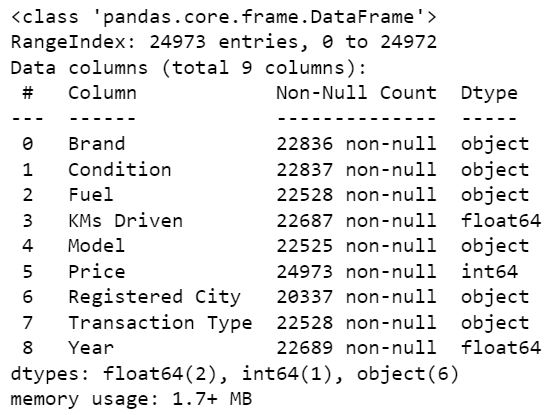
Looking at the non-null counts it is clear that only for the Price column the data is complete. For all other columns there are missing entries. For a customer buying a new car, the most important information is the price, the kilometers (in used cars) driven and the release year. I will next replace the missing values for kilometers driven and year with the average values of the respective columns.
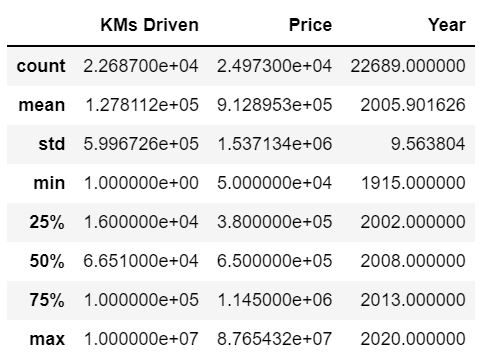
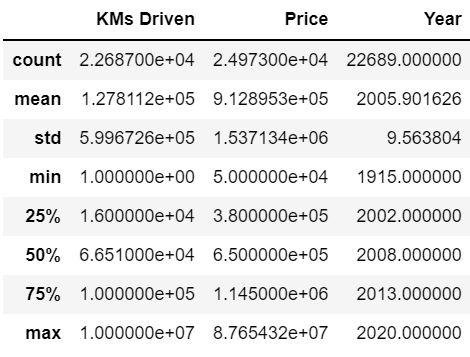
Using the decribe method we can easily fetch the mean values of kilometers driven and year.
Replacing Missing Values
cars_df['KMs Driven'].replace(np.nan, cars_df['KMs Driven'].mean(), inplace=True)
cars_df.Year.replace(np.nan, cars_df.Year.mean(), inplace=True)
Now using the info method we can verify that the data for driven kilometers and year columns is also complete
Exploratory Data Analysis
I will explore the different columns in the dataset to gain some insight into the data. This would be done mostly by drawing different graphs. Visualization of the data would help to draw interesting conclusion from the data
Popular Models
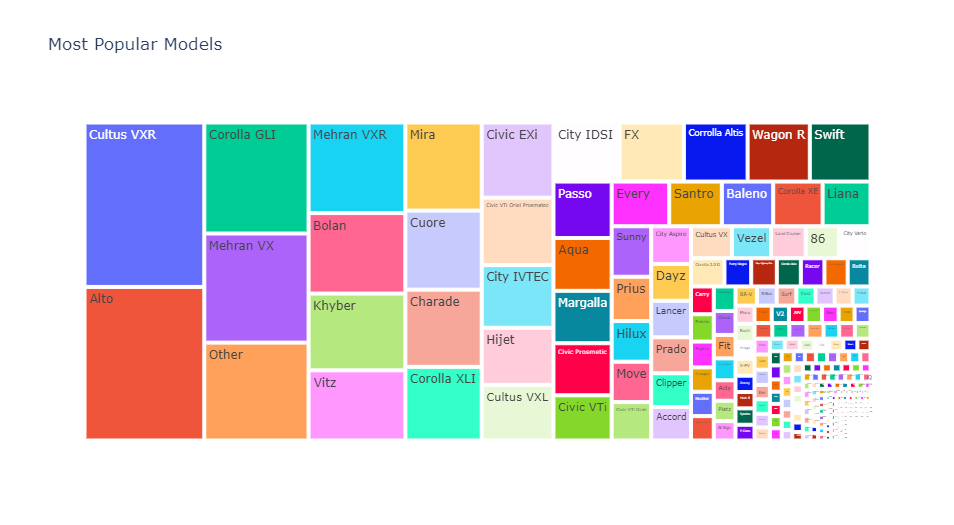
The most popular car models are Cultus VXR, Alto, Corolla GLI, Mehran VX, Mehran VXR and Bolan.
Popularity of Release Years
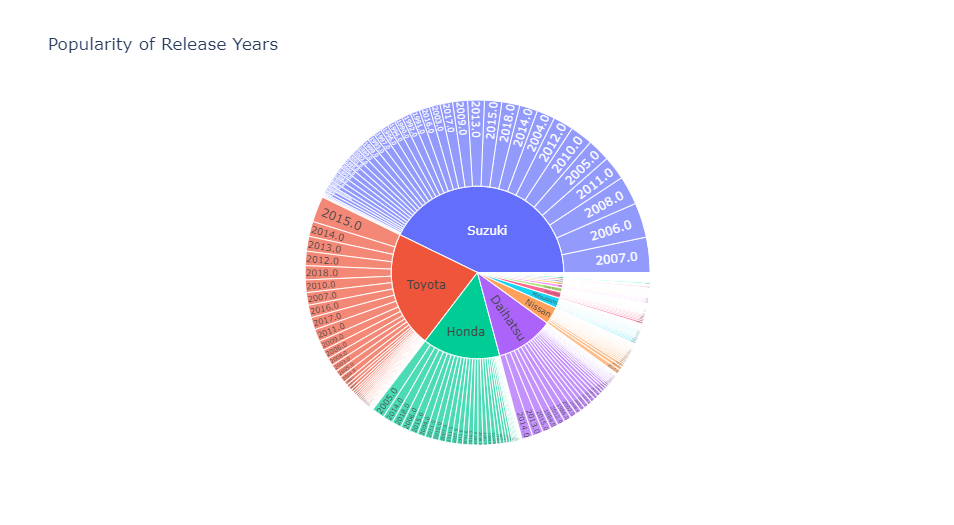
The cars from the last 15 years starting from Release Year 2004 are popular ones.
Relationship between Car's Release Year and Price
The better way to study this relationship is to consider the age of car than than the year when it was released. Let's add another column in the dataframe for the age of car. The age is calculated with the help of datetime library in Python.
Adding Age Column
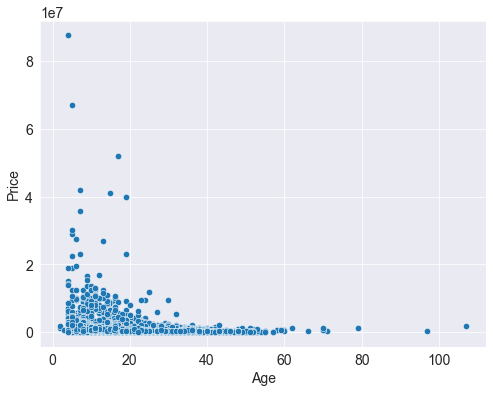
It's an inverse relationship with the price decreasing as the age of the car is increasing. As the cars prices vary in very large range, so it would be better to plot the price in logrithmic scale
Adding Log Price Column
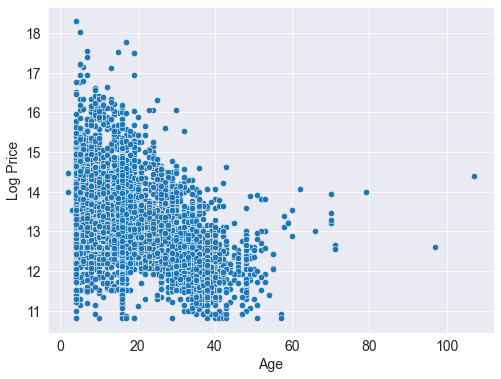
On the logrithmic scale, the visualization becomes much clearer than before and the inverse relationship is more obvious
Relationship between Mileage and Price
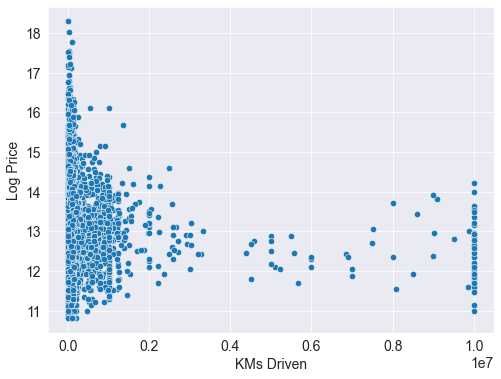
The relationship is exponentially decreasing. The cars which have mileage less than 1000 kilometers are considered new and the cars which have mileage more than 1 million are very rare as they are not considered to be in good condition. Let's drop the rows in the data accordingly for better visualization
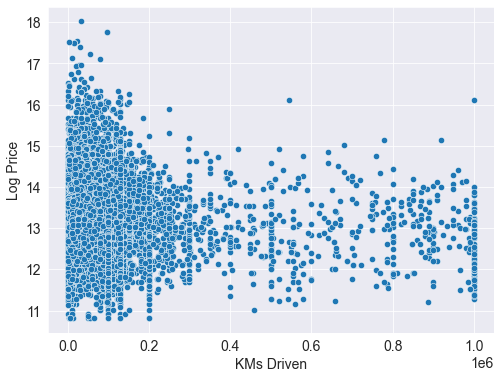
The relationship is exponentially decreasing. The price of car decreases sharply with increasing mileage
European Vs. Non-european Brands
Let's divide the brands into non-european and european brands and study the same relationship
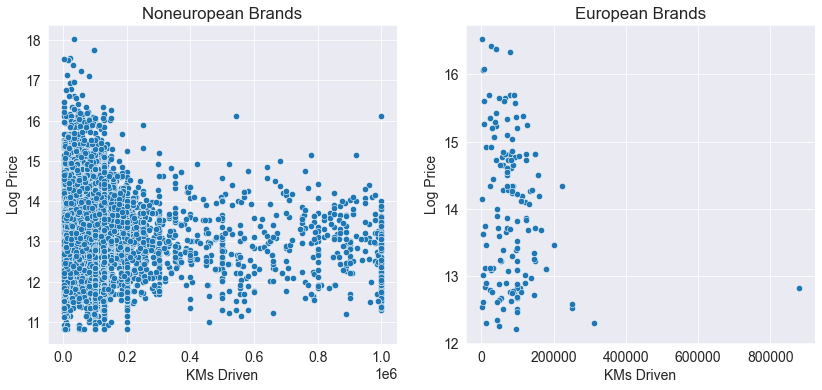
The european car brands are very rare in Pakistan, so not enough data is available to draw any clear inferences. The available data only contains less than 1% of european cars as compared to the overall car's data
Popularity based on Fuel
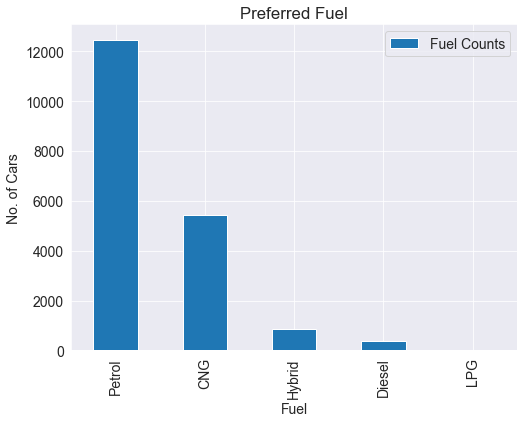
From the above bar graph it can be easily visulaized that the people in Pakistan prefer to drive mostly Petrol cars. LPG cars have the lowest numbers of drivers in Pakistan as this fuel is not available in abundant in Pakistan
Sales of Top 10 Brands
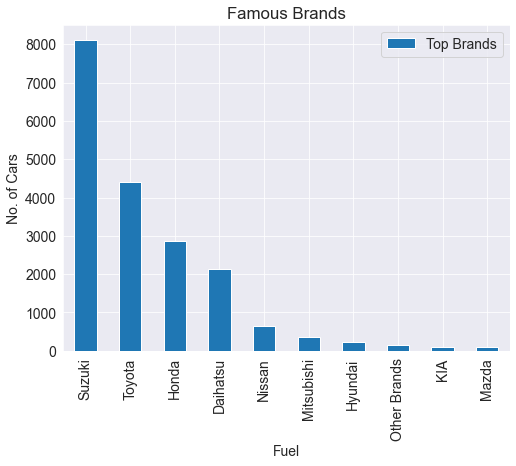
The bar plot shows that the people in Pakistan prefer cars from Japenese brands as the most selling cars from the top 10 brands in Pakistan are from Japenese brands. This is obvious as the most of the Japenese car companies have manufacturing plants in Pakistan
Correlation between Release Year and Kilometers Driven
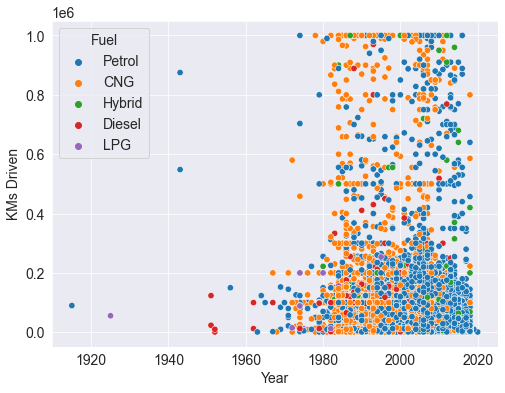
The above scatterplot shows that Pakistani people like to drive cars of the new models i.e. released between 1980 and 2020. For the cars between 1980 and 2000 models, the preferred fuel was CNG as it is the cheapest fuel available in Pakistan. For the 2000 - 2020 model cars, the people tend to shift to the Petrol cars due to the shortage of CNG in Pakistan lately
Cities with Highest Registration of Cars
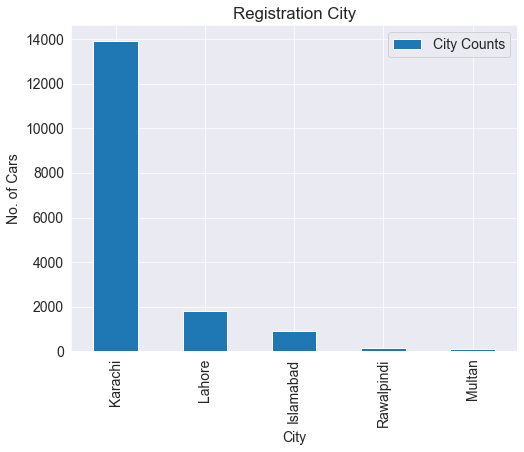
Most of the cars sold online are registered in Karachi and Lahore, which are the two biggest cities of Pakistan according to the population. Islamabad, the capital of Pakistan lies at the third position as most corporate people live there. Next two positions are occupied by Rawalpindi and Multan for cars registration, which also lies in the list of top 10 most populas cities of Pakistan. So it can be concluded that most of the car's business is being done in the most populas cities of Pakistan
Most Expensive Car Brands
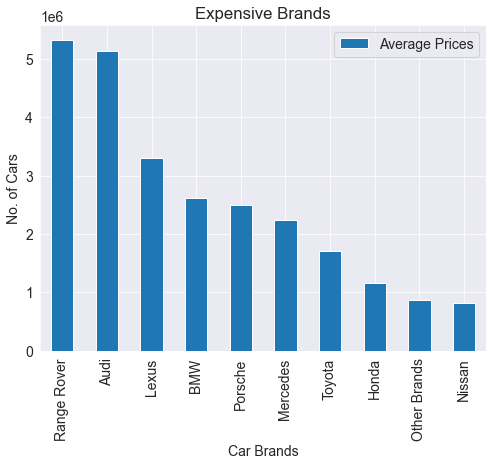
The figure shows that the most expensive barnds are european brands like Range Rover, Audi, Porsche, BMW etc as the cars from these barnds get imported in Pakistan. These brands don't have manufacturing in Pakistan
Distribution of Kilometers Driven
The used cars which had already been driven less than a million are still considered to be in good conditions in a country like Pakistan. So let's visulaize the distribution of kilometers driven by cars
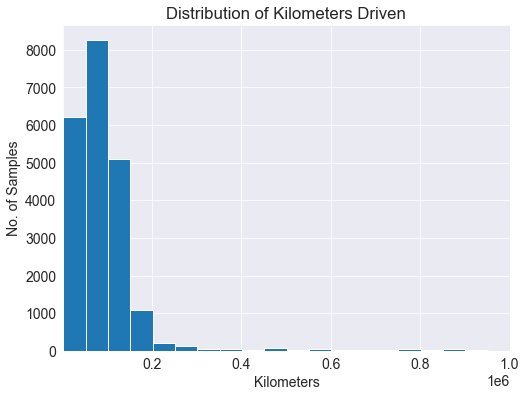
The histogram shows that the the used cars which had been put up for the sale online are mostly driven between 50 thousand and 2 lack kilometers while a very less number of cars which are driven more than 2 lack are available online. It means people prefer to buy cars which are driven less than the 2 lack kilometers
Distribution of Price
Lets explore the distribution of car's prices in range of 1 lack and 1 million
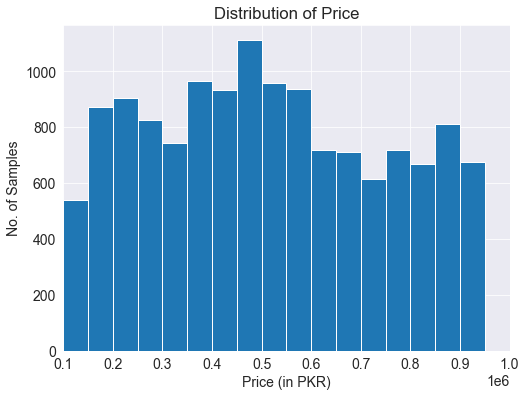
The distribution shows that the number of cars are almost evenly distributed in the explored price range with the large number of cars lies in the range less than a half a million. It means people in Pakistan prefer to buy cars which cost less than half a million
Price Distribution of Top 3 Brands
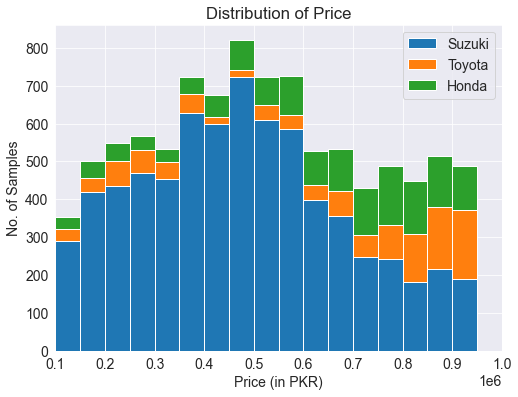
Among the top three brands in Pakistan, people again prefer to buy cars with the prices lower than half a million. The major car brand in this price range is Suzuki, which is the most famous brand in Pakistan. The distribution also shows that the Toyota and Honda cars are relatively expensive than the Suzuki cars as the sample density of Toyota and Honda cars tend to increase after half million price range
Answering Some Basic Questions
What is the average price of Suzuki, Toyota and Honda cars i.e. the 3 most famous car brands in Pakistan?
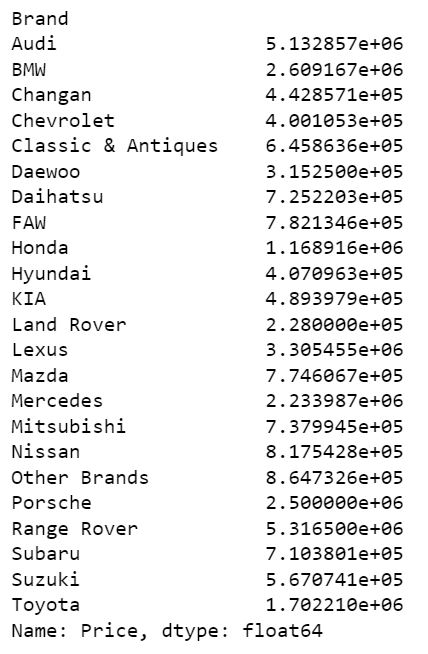
The average prices of Suzuki, Toyota and Honda cars are 5.6, 1.65 and 1.14 Million Pakistani Rupees
Cars from which release years are most cheapest (on average) in Pakistan for the release years beyond 2000?
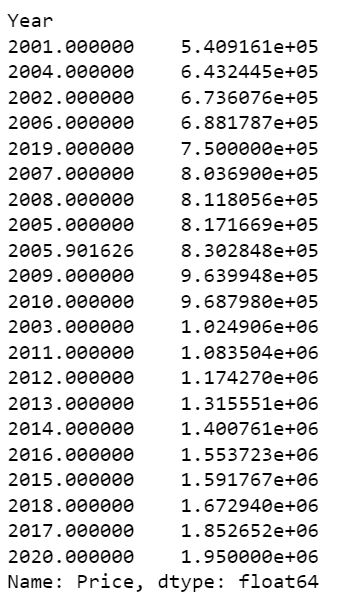
The cars from the release year 2001 are the cheapest one's among the cars which were released after Year 2000
Which brand cars have covered most kilometers on the roads?
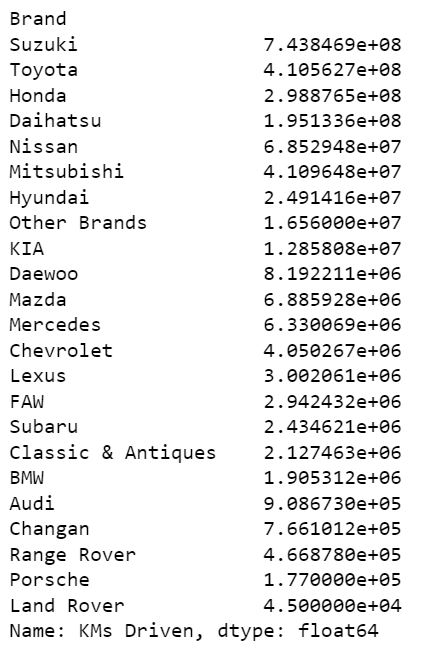
Suzuki, Toyota and Honda i.e. Japenese brand cars have been driven the most in Pakistan
Which fuel type cars are cheapest on average?
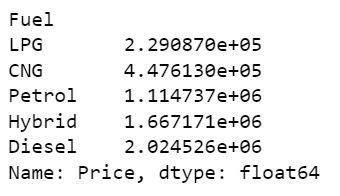
Although LPG is not available in abundant in Pakistan but still LPG cars are on avergae cheapest in Pakistan
Which city has the highest registered Mercedes cars?
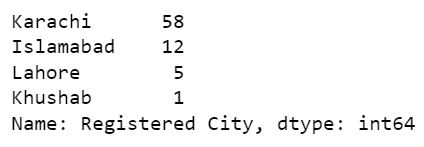
Merecedes cars are registered most in Karachi, which is the biggest city of Pakistan according to the population
Conclusion
Following inferences and conclusions can be drawn from the the exploratory analysis of the data: